Rigs of the 2024 Tour Divide Stats Analysis
Over the past week, we plugged 100 submissions from the Rigs of the 2024 Tour Divide into a spreadsheet to get a clear picture of the bikes and gear used in this year’s event. In this piece, we dive into the data and uncover some interesting stats, including where people are from, and the types of bikes, tires, drivetrains, gearing choices, and cargo setups they’re using, and much more. Dig into the Rigs of the 2024 Tour Divide Stats Analysis here…
PUBLISHED Jun 21, 2024

As is tradition, we published our Rigs of the 2024 Tour Divide roundup last week. It’s our largest rig roundup to date, with over 150 submissions, and we split them into two parts: flat-bar and drop-bar. The riders are almost a week into their journey now, which means things are just getting started for some, while the fastest riders are already halfway through their epic 2,700-mile journey.
It’s exciting to scroll through the rig submissions to see what tires people are running, who’s using the latest and greatest, who’s relying on tried-and-true bike tech, and, of course, what types of bikes are the most popular. In this video, I took the first 100 submissions, plugged them into a spreadsheet, and took a deep dive into the data. I think a few things will surprise you. Watch below and then scroll down for a written version, complete with pie charts and graphs to outline the stats.
Types of Bikes
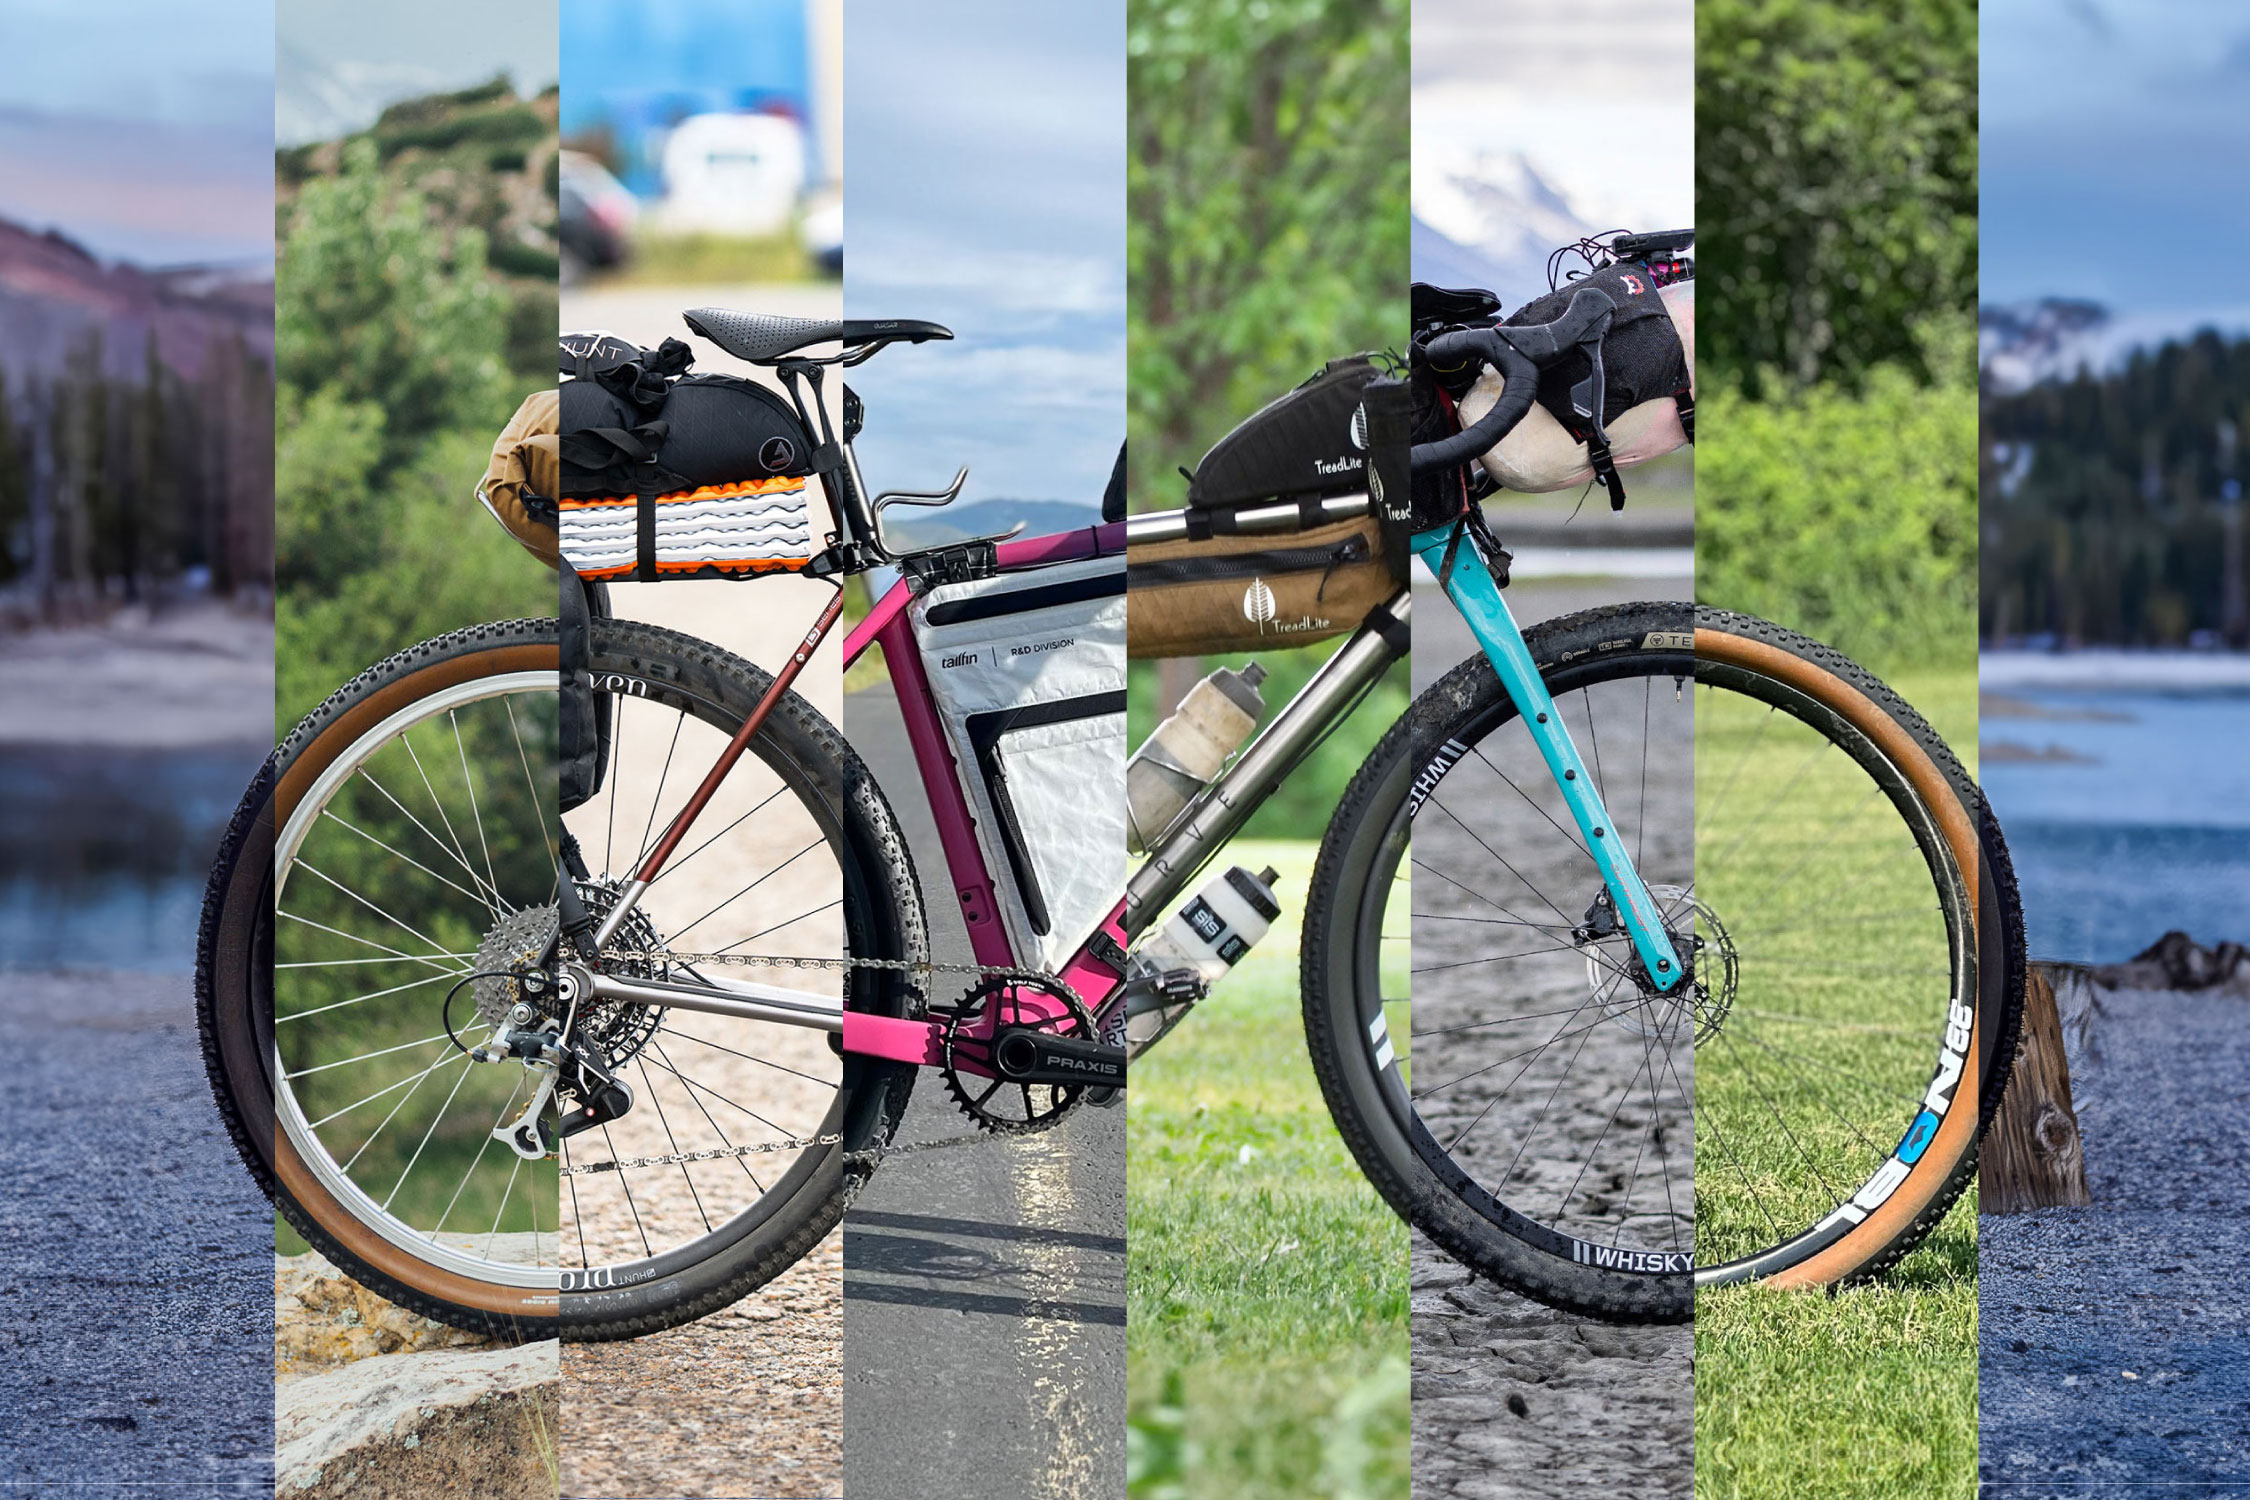
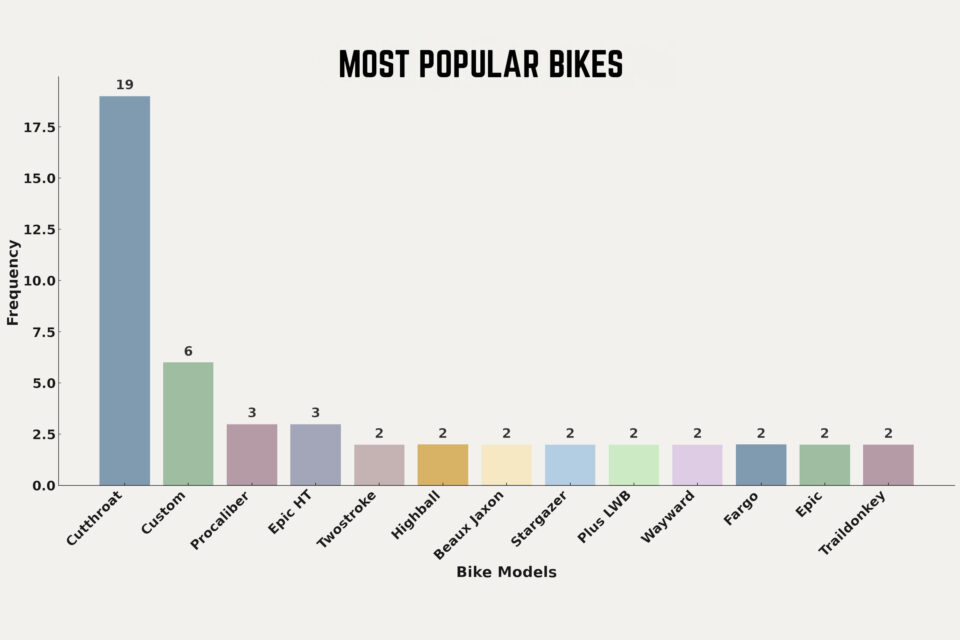
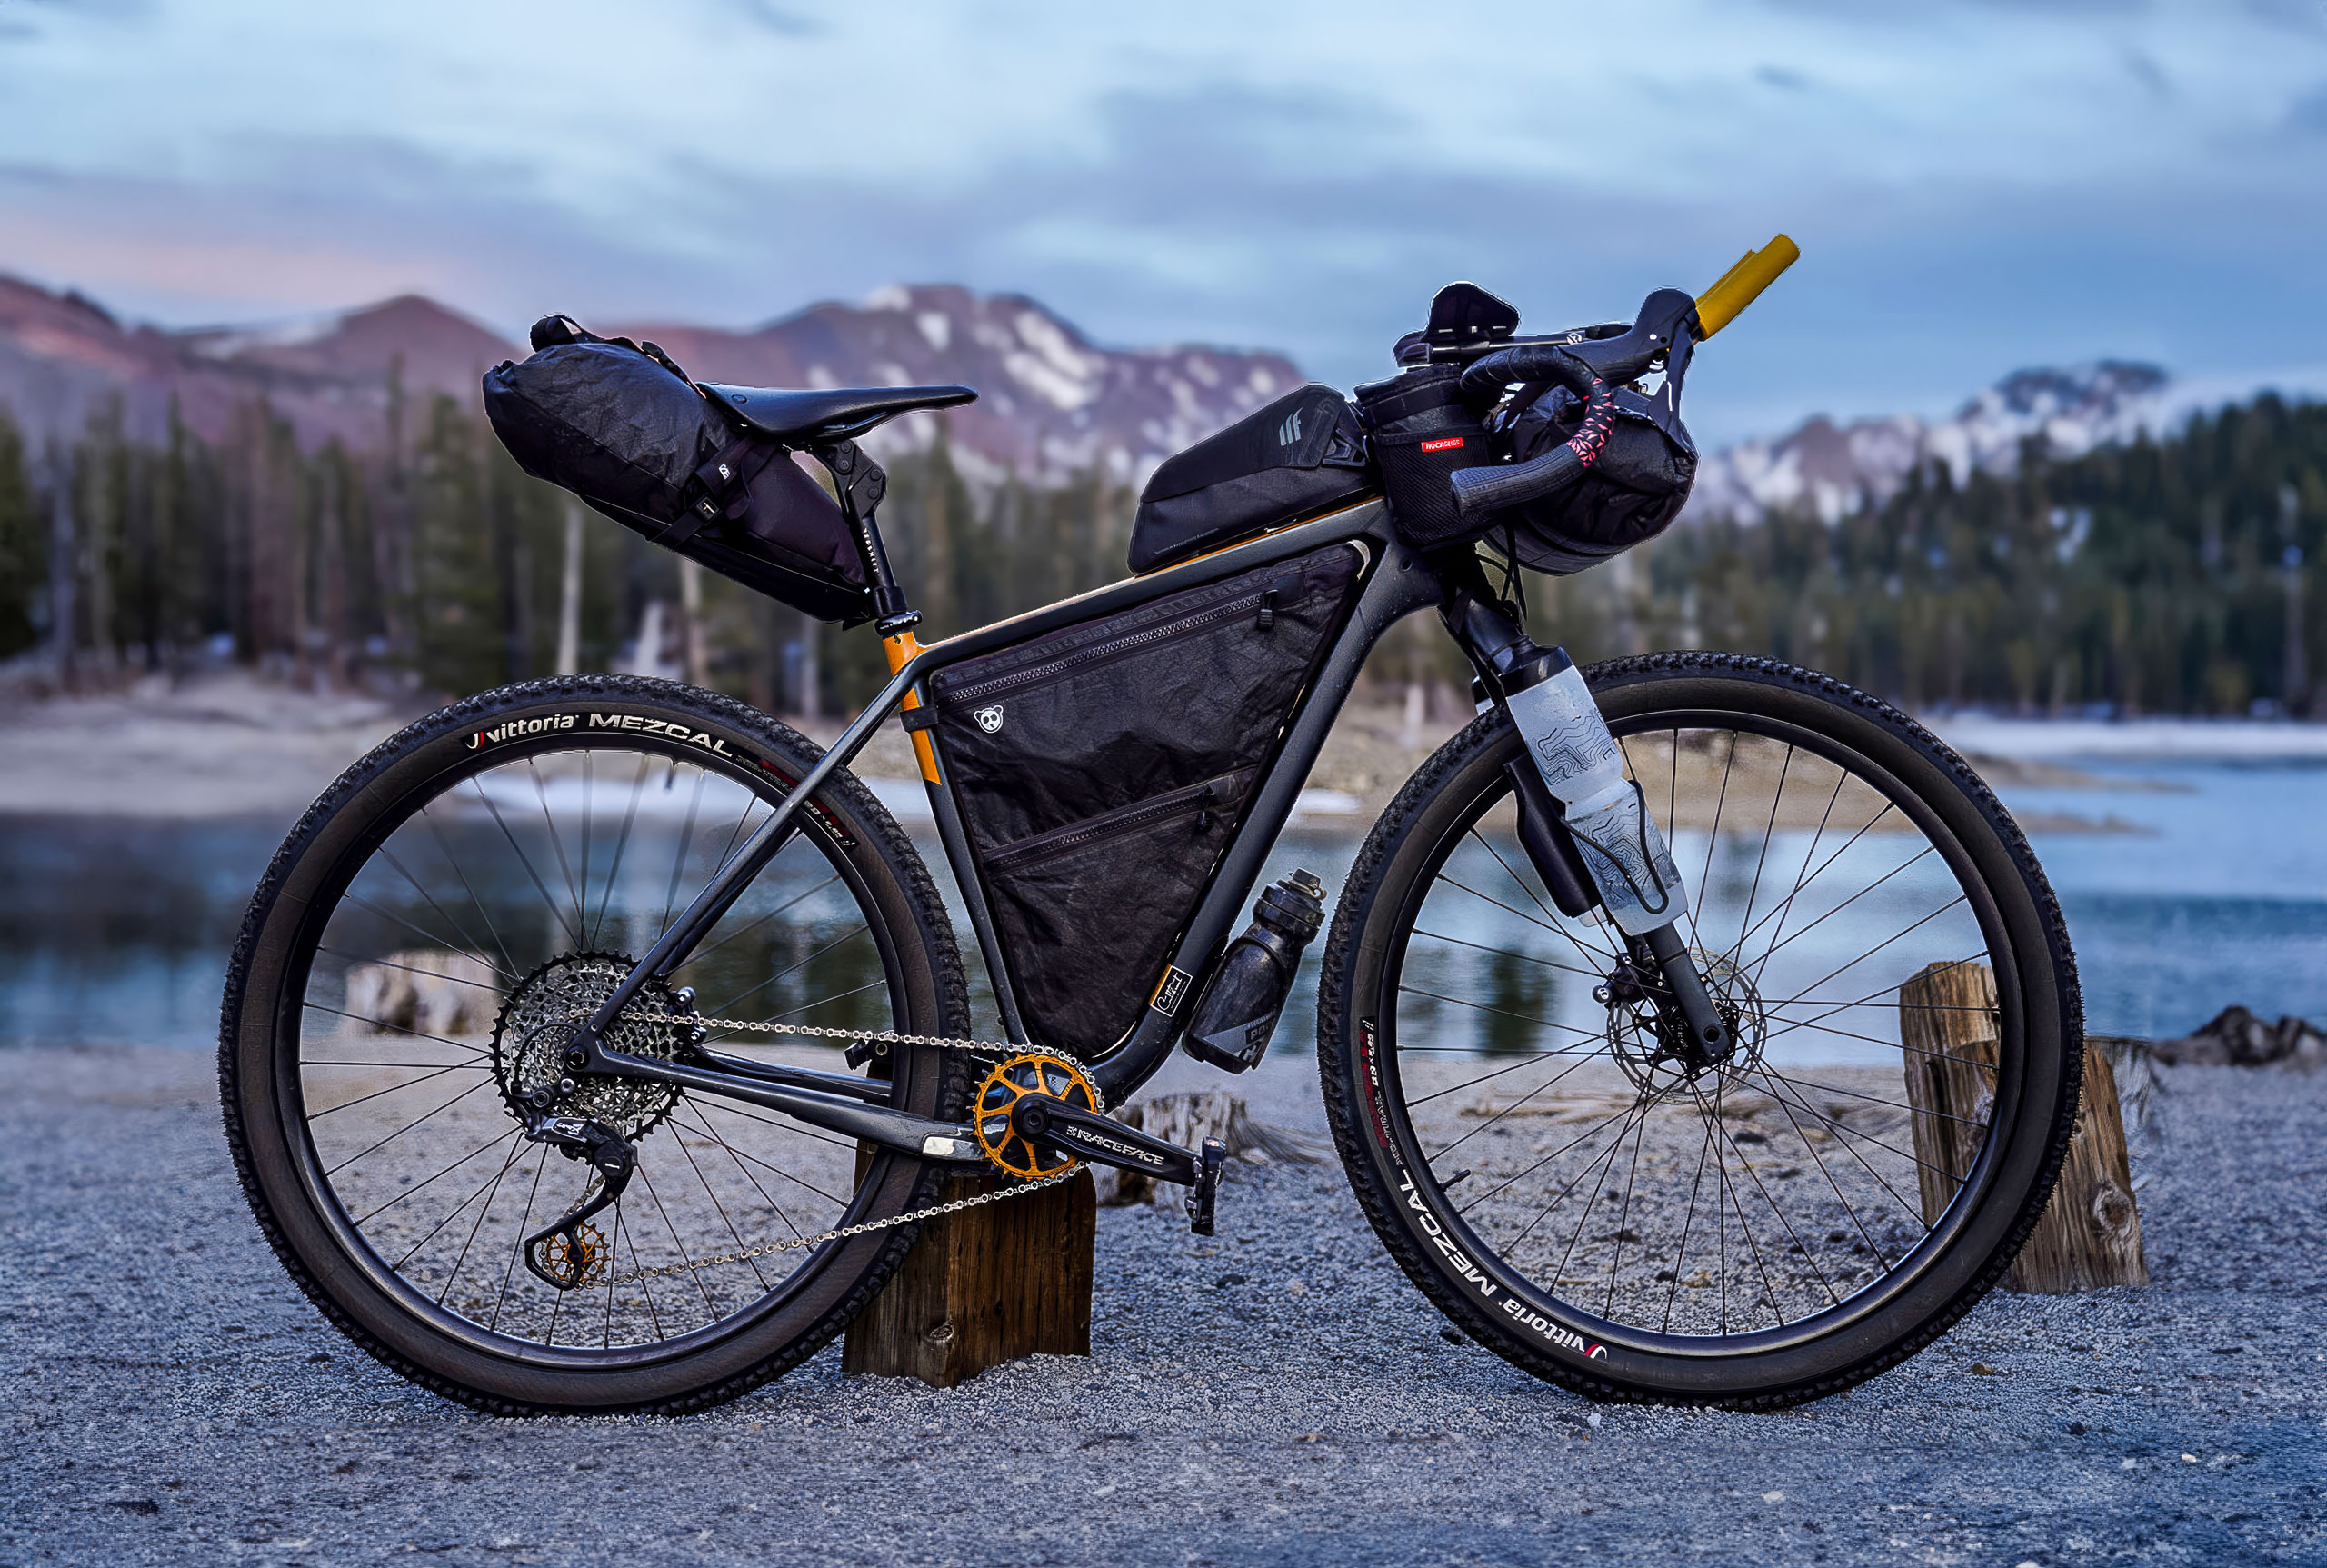
Let’s start with the bikes. This year is very similar to last year, but there are also some notable differences. In total, 45 brands are represented, and 63 different bike models are being used. Like last year, the Salsa Cutthroat is the most popular, with 19% of participants riding it. The next most popular category is custom/handmade bikes, with six rigs, five of which are flat-bar bikes.
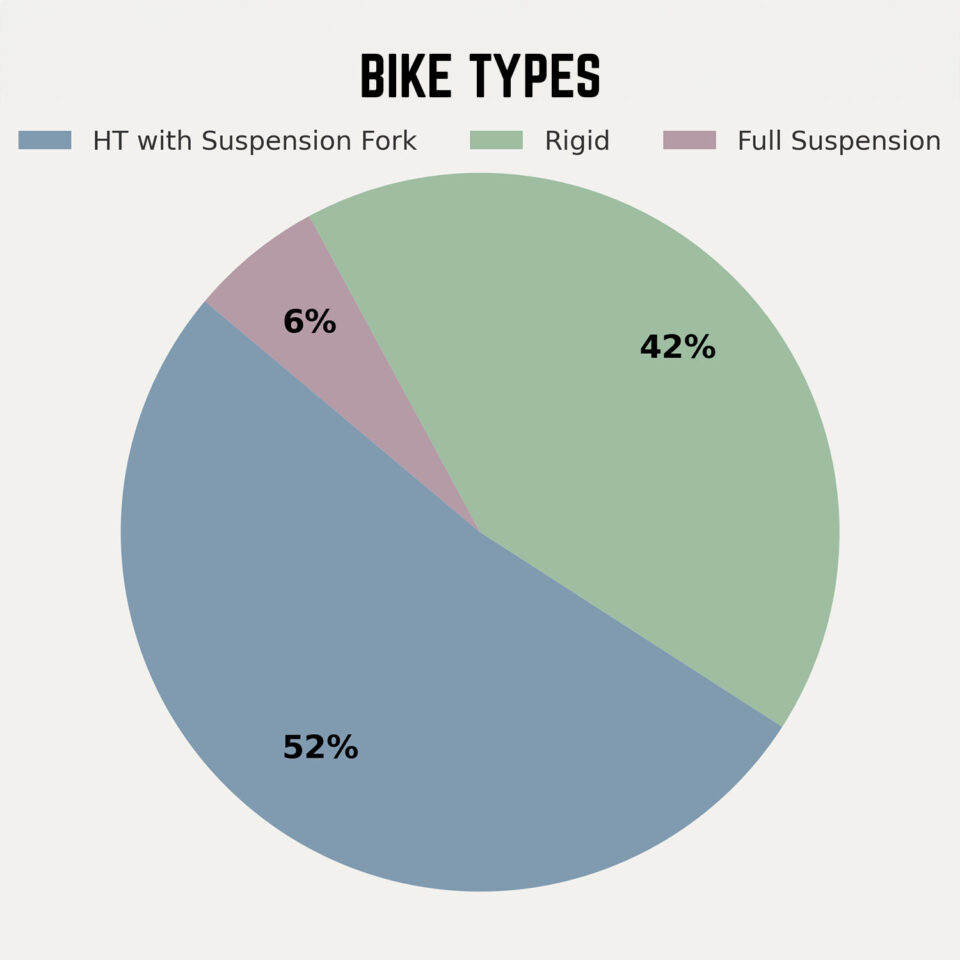
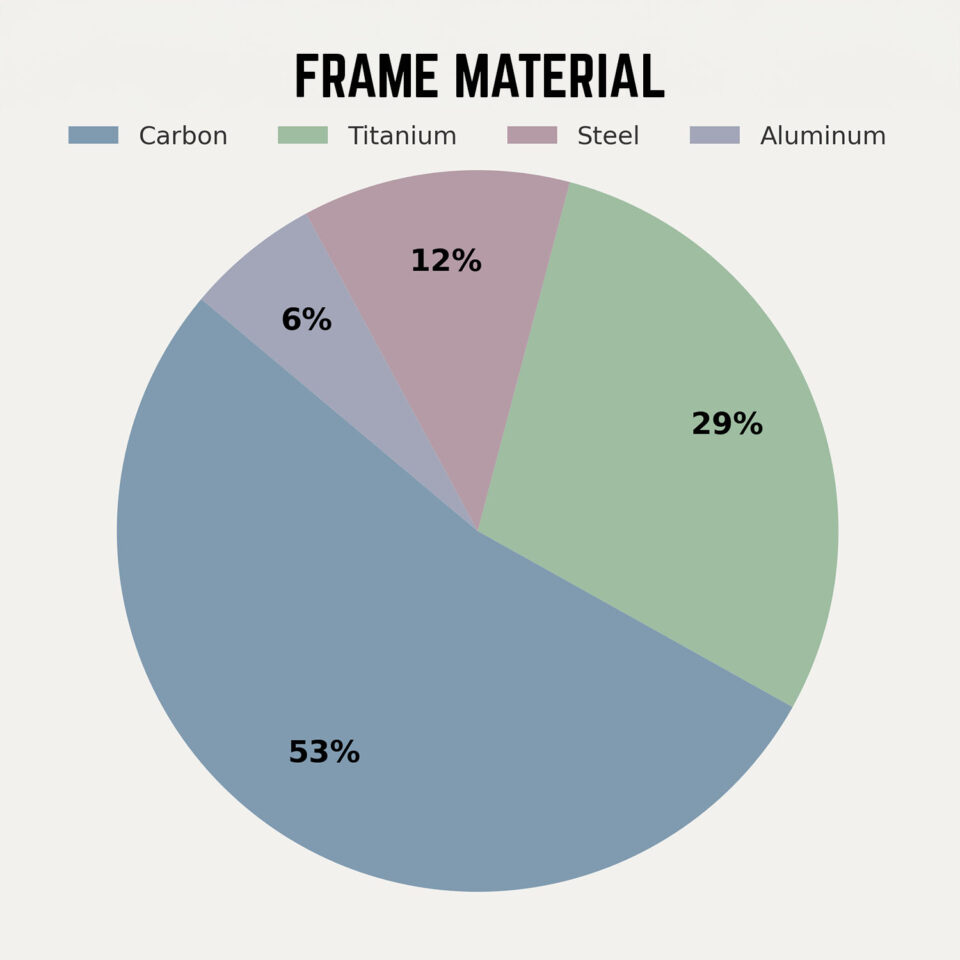
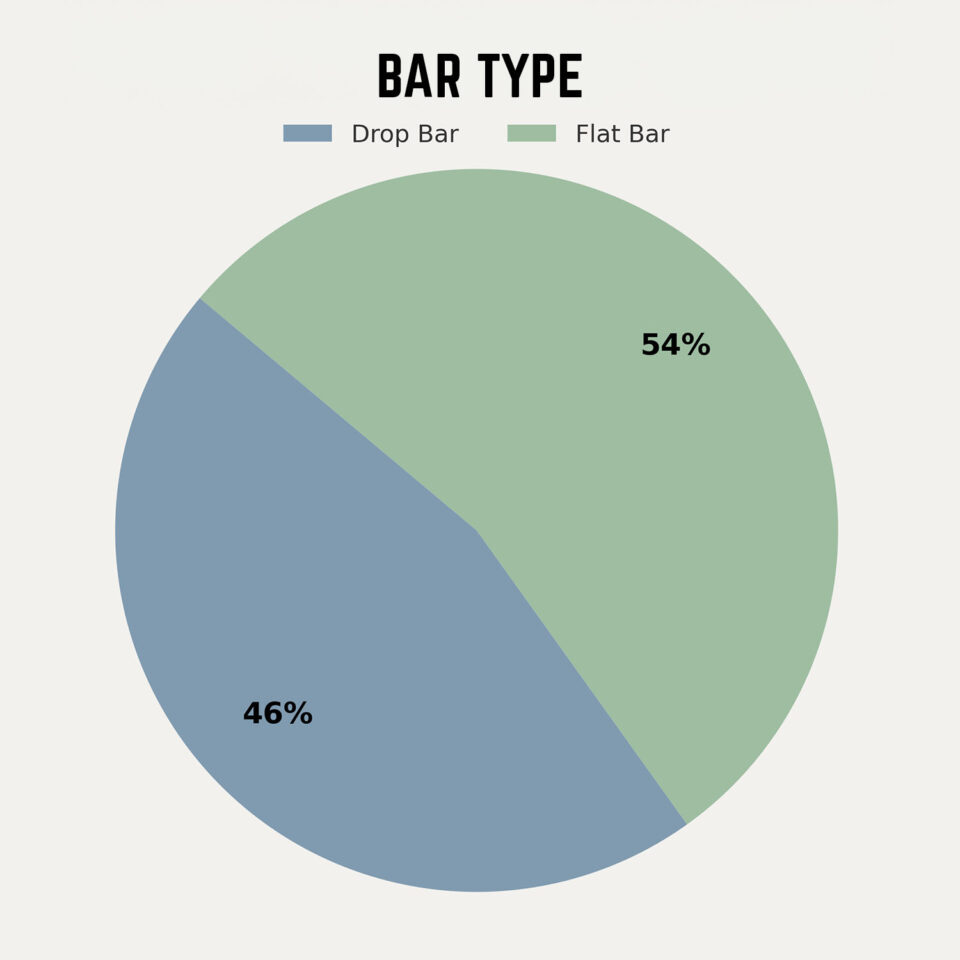
Diving a bit deeper, over half of the bikes are carbon, 29% are titanium, 12% are steel, and 6% are aluminum. Comfort is clearly a priority for many participants, as over half of the riders use some form of suspension (roughly 52%), while 42% have rigid forks, and just six participants have full-suspension bikes. Wrapping up our bikes portion, the preference for flat and drop bars was nearly evenly split, with 54 bikes featuring flat bars and 46 featuring drop bars.

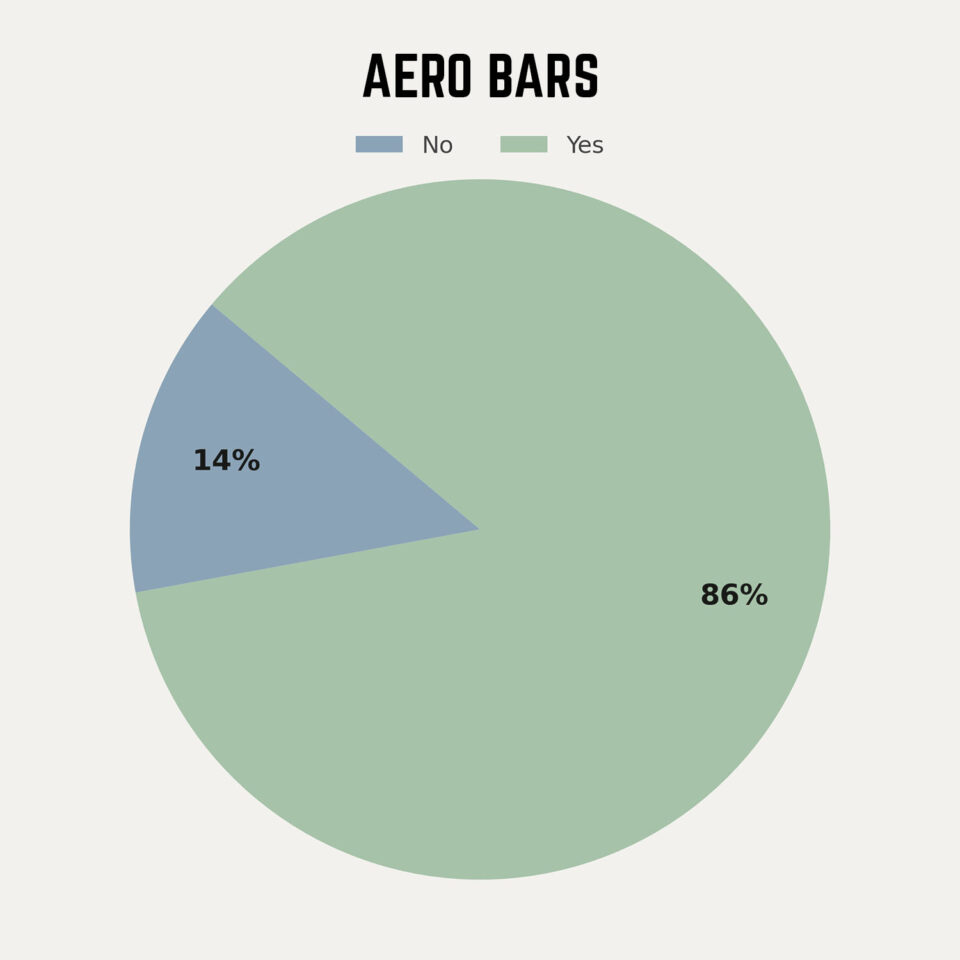
Just for kicks, I checked to see the difference between material and drop or flat bar, and the biggest difference was that there are 22 titanium flat-bar bikes and only seven titanium drop-bar bikes. Oh yeah, and only 14 bikes are without aero bars, so that makes 86% of folks running forearm couches for speed and comfort.
Drivetrains
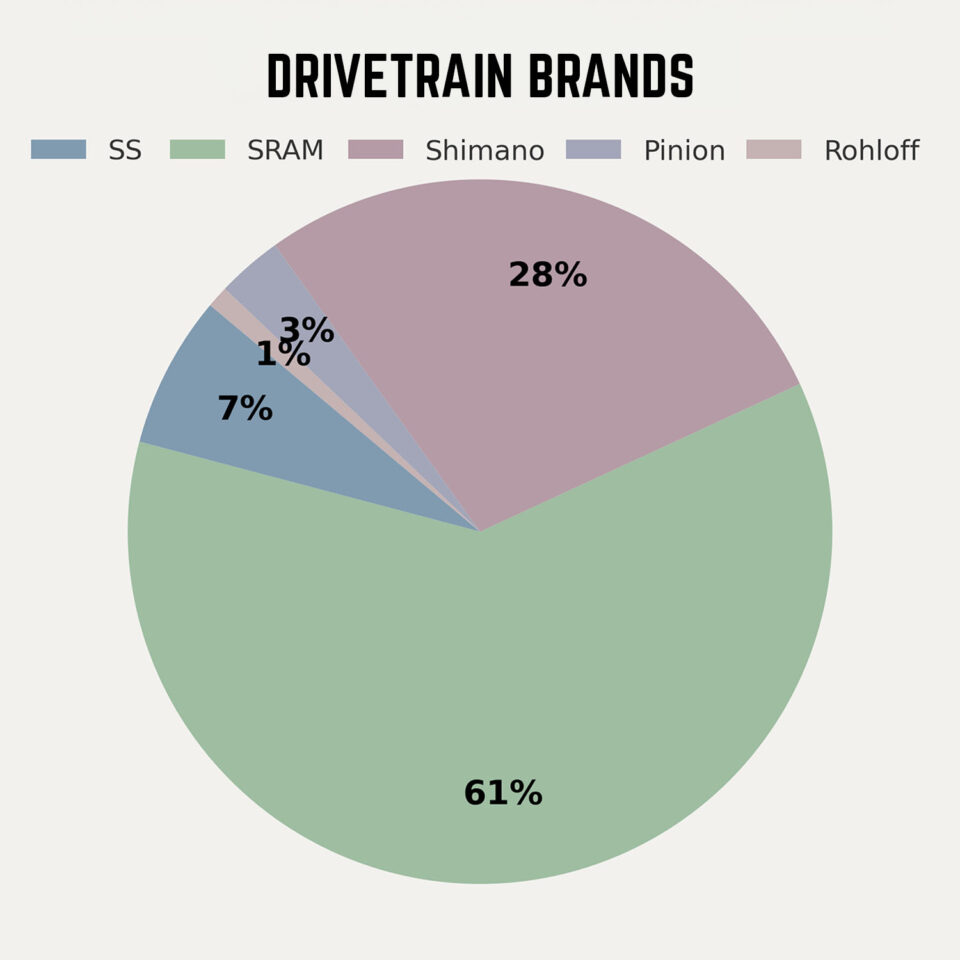
The results for drivetrain preference are pretty similar to last year. SRAM was clearly the most trusted drivetrain last year, and it continues to dominate this year, with 61% of participants using some sort of SRAM setup. Shimano comes in second at 28%, Pinion at 3% (is an increase from last year), and Rohloff at 1%. Additionally, 7 participants are singlespeed riders.
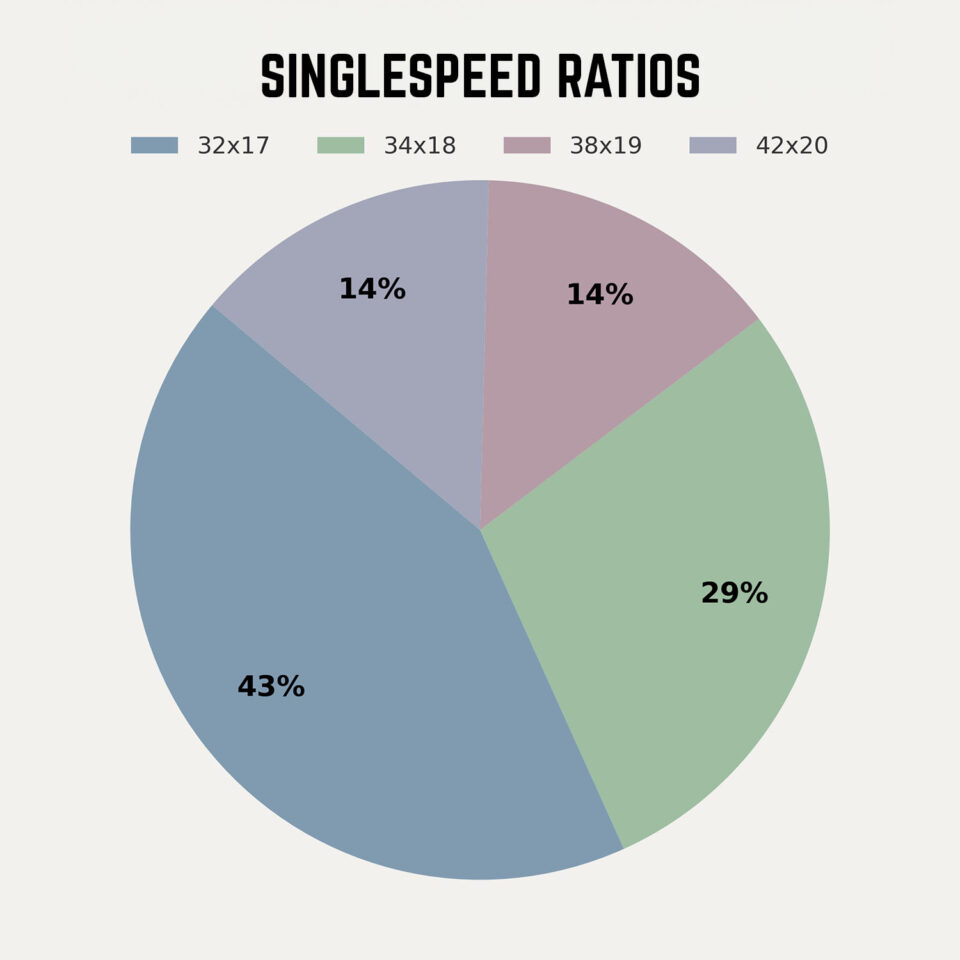
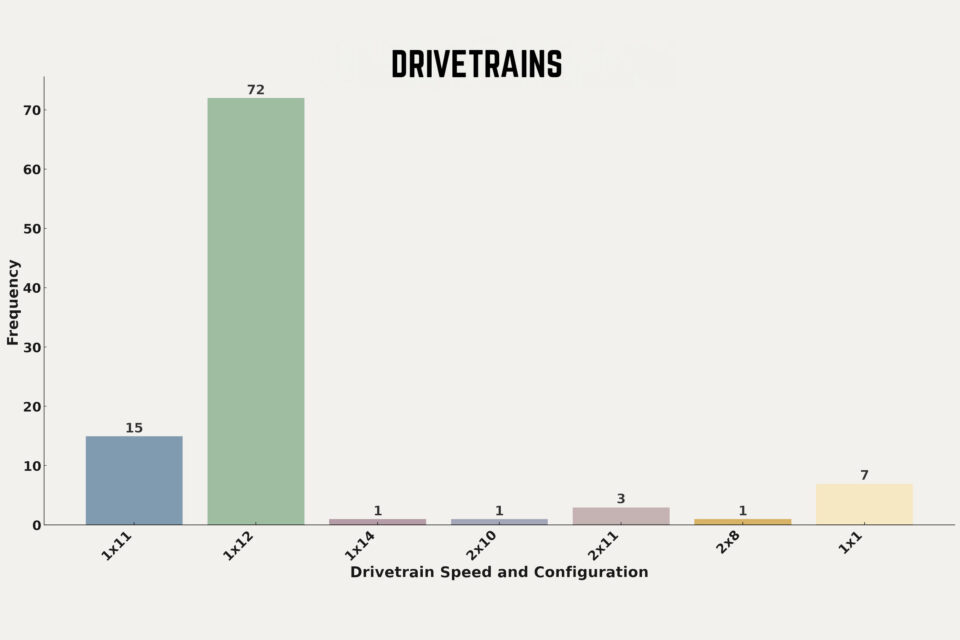
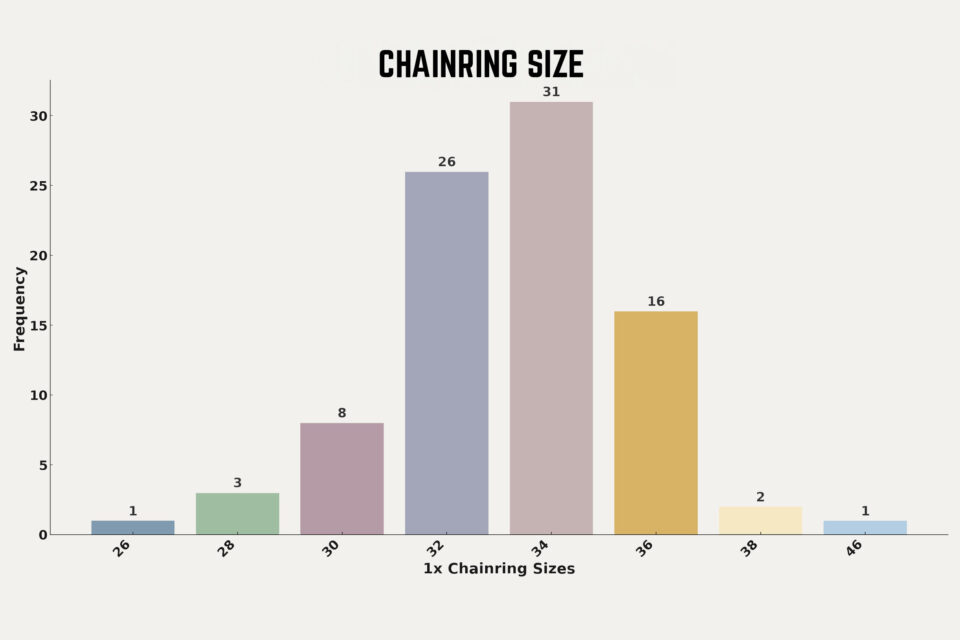
Given SRAM’s preference for 1x setups, it’s unsurprising that there are 71 1×12 drivetrains, 15 1×11 drivetrains, and one 1×14 Rohloff, making 87% of the bikes equipped with 1x drivetrains. There are also five bikes with 2x drivetrains featuring 8-speed, 10-speed, and three 11-speed setups. The seven singlespeed bikes have varied gear ratios: three with 32x17T, two with 34x18T, one with 38x19T, and one with 42x20T. We also gathered data on chainring sizes this year, which was a popular request from last year. Among the 1x bikes, the most popular chainring size is 34T, used by 31 bikes, followed by 32T and 36T. As expected, flat-bar bikes typically use smaller rings, while drop-bar bikes use larger rings.
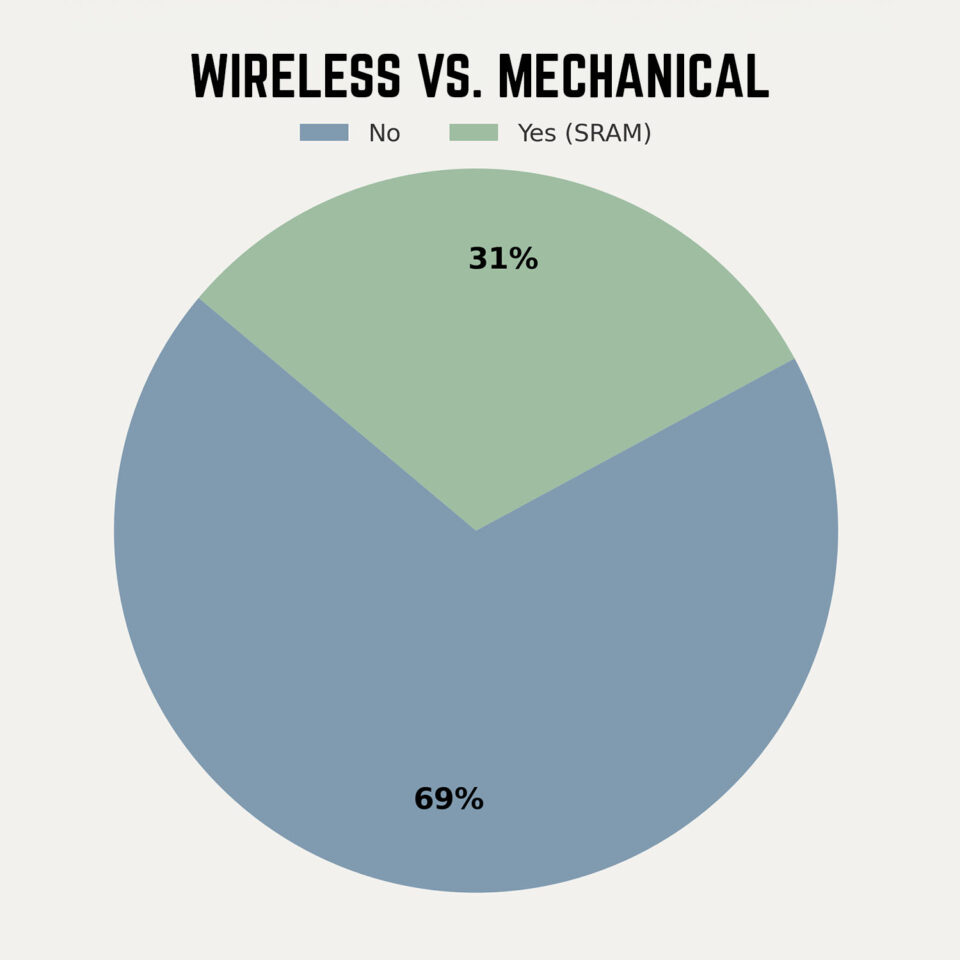
Finally, in terms of electronic shifting, SRAM also led this category. Like last year, no bikes in our sample are equipped with Shimano Di2. All 31 participants using electronic shifters are equipped with SRAM AXS 1x systems, with many using the new Transmission. Of the electronic bikes, 19 had drop-bars and 12 had flat-bars.
Tires and Tire Size
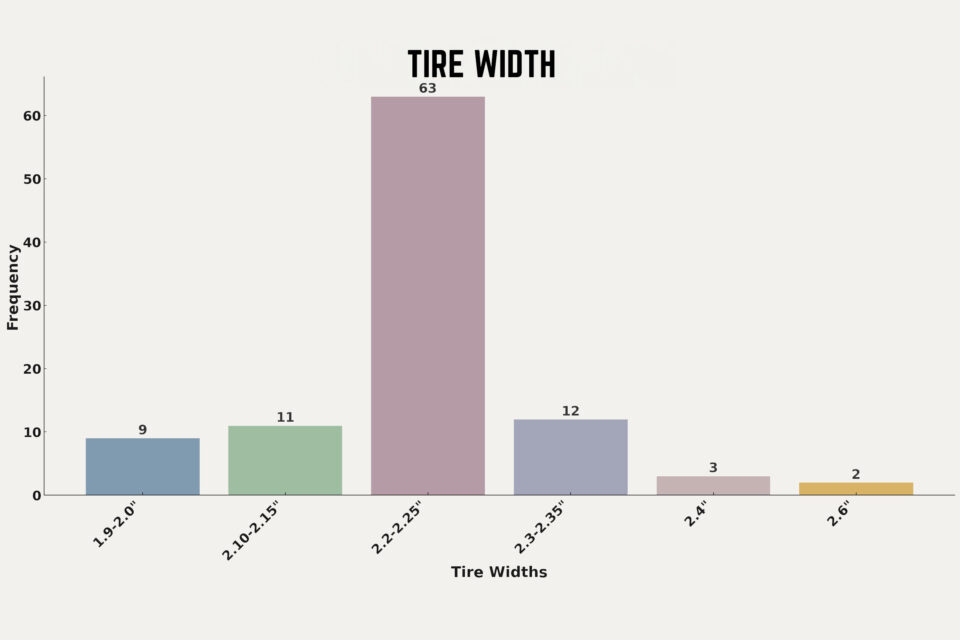
Tire choice and size are easily one of the most debated topics of the Tour Divide. It’s no surprise that 29″ wheels are the most popular again, with 91% of riders using them and only 9% using 27.5″ wheels. I broke down tire sizes into six different categories, and the results are telling. The 2.2-2.25″ category is the most common, used by 63% of riders, followed by the 2.3-2.35″ category at 12%, and 11% using tires in the 2.1-2.15″ range. This means that 86% of riders are using tires between 2.10″ and 2.35″ wide.
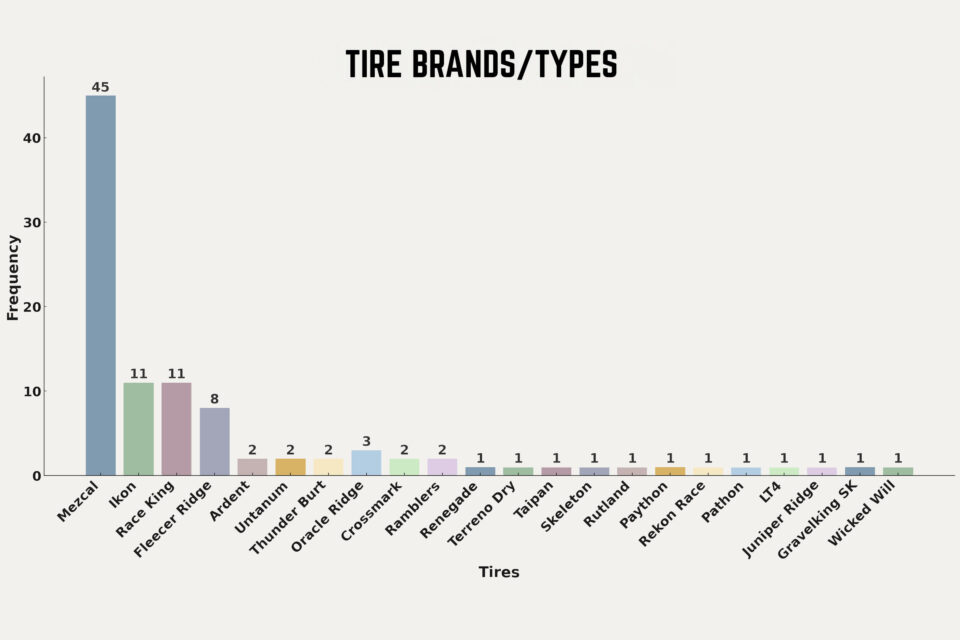
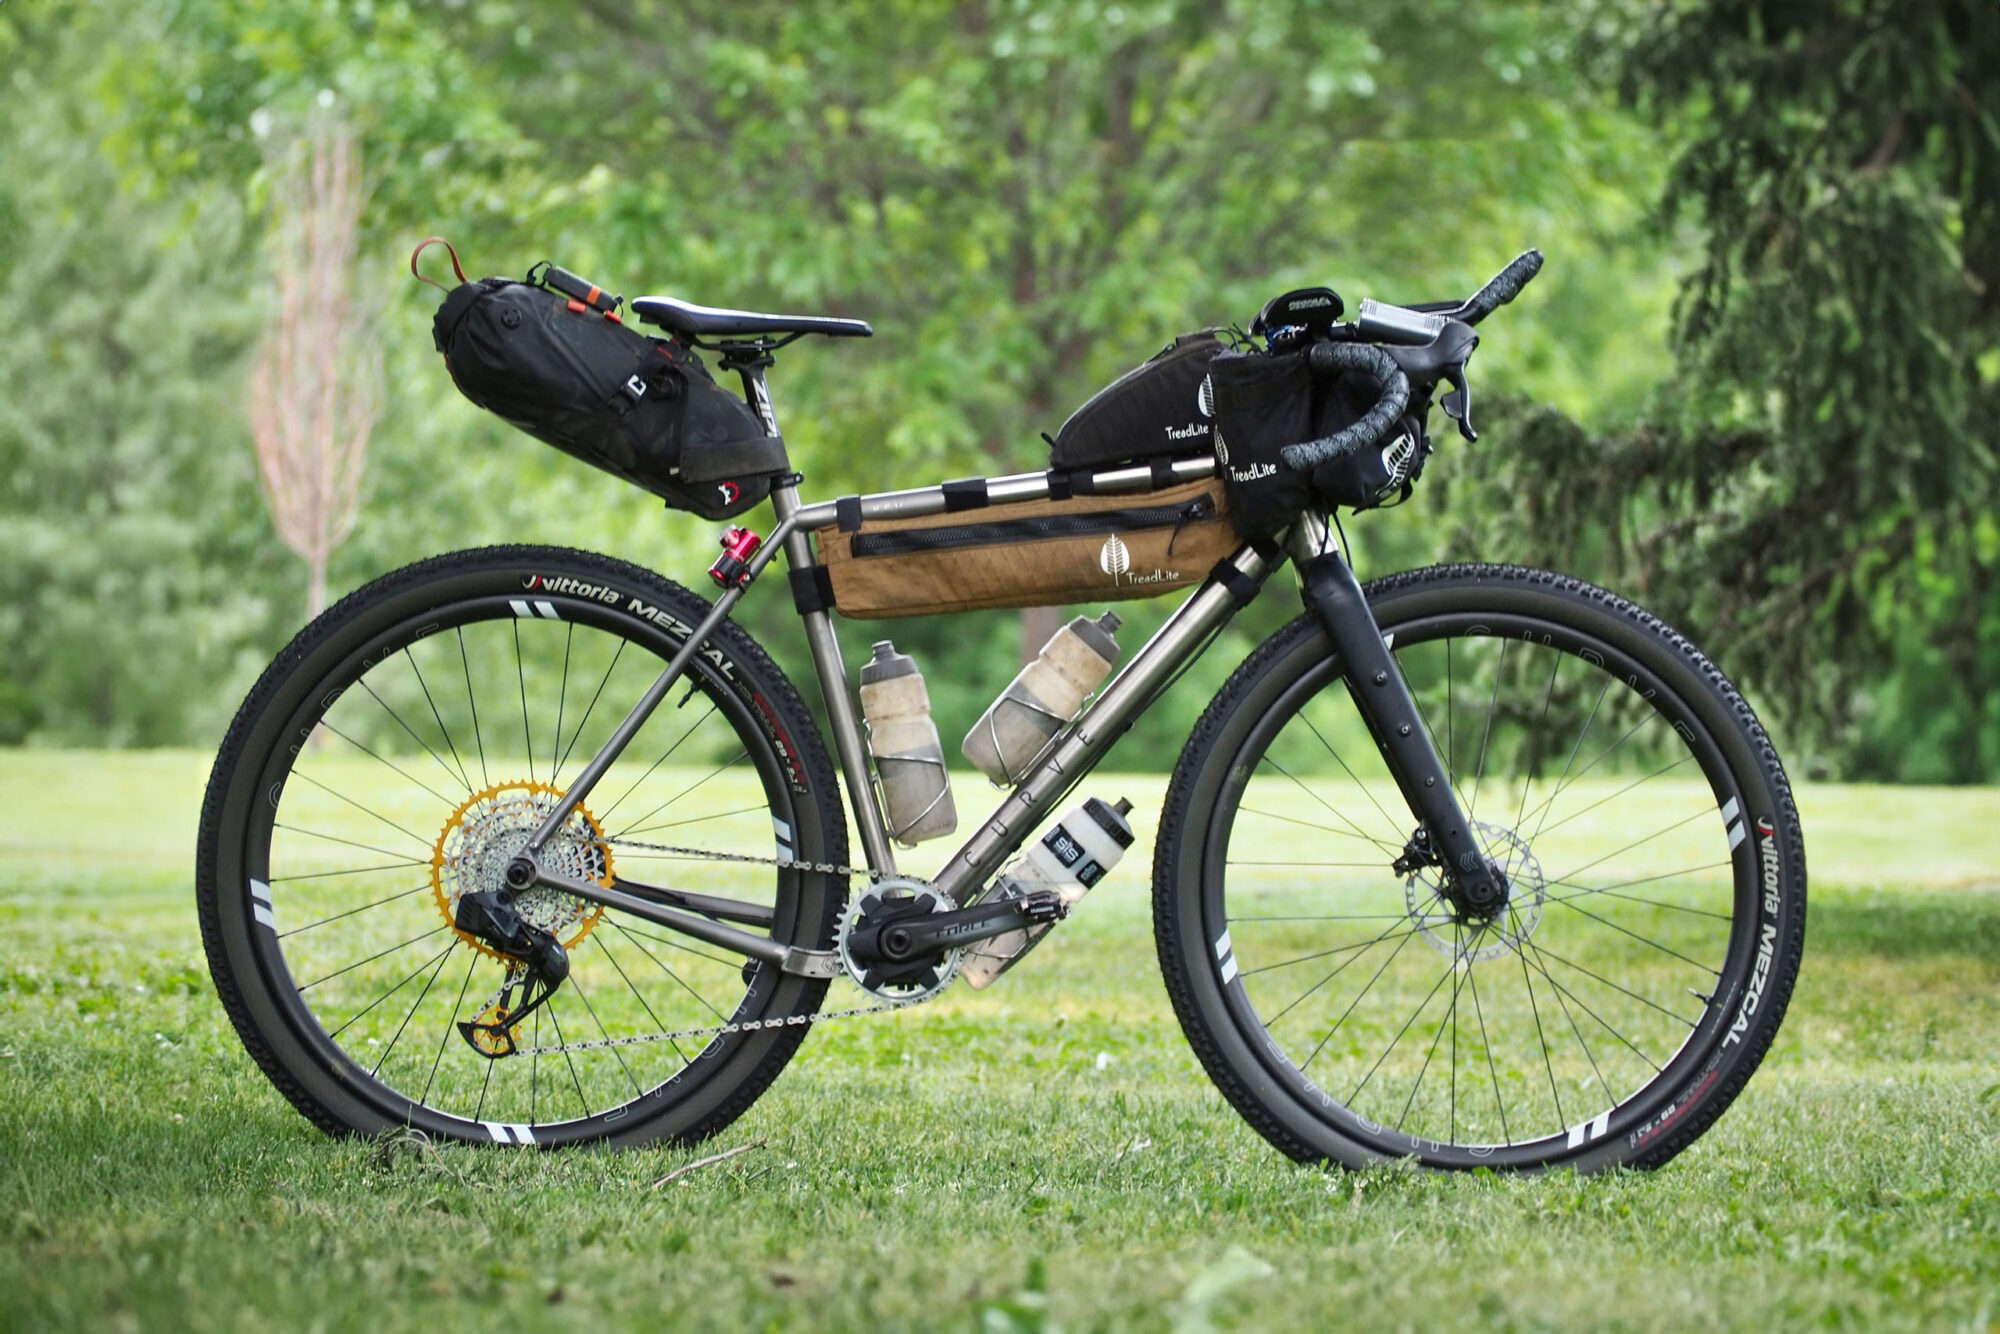
In terms of tire brands, Vittoria once again dominates with 46 riders using their tires, followed by Maxxis at 18 and Rene Herse rounding out the top three at 14. Specifically, the Vittoria Mezcal is overwhelmingly popular, with 45 of the 46 Vittoria users choosing this tire. The second most common tires are the Maxxis Ikon and Continental Race King, each used by 11 riders. Overall, 10 tire brands are represented, with a total of 23 different tire models.
Bags and Cargo
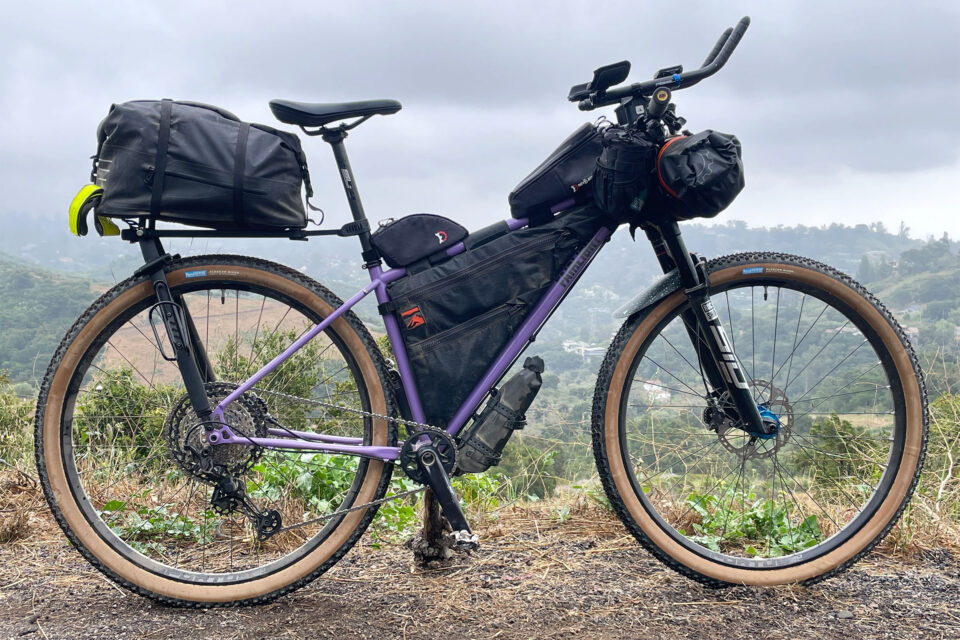
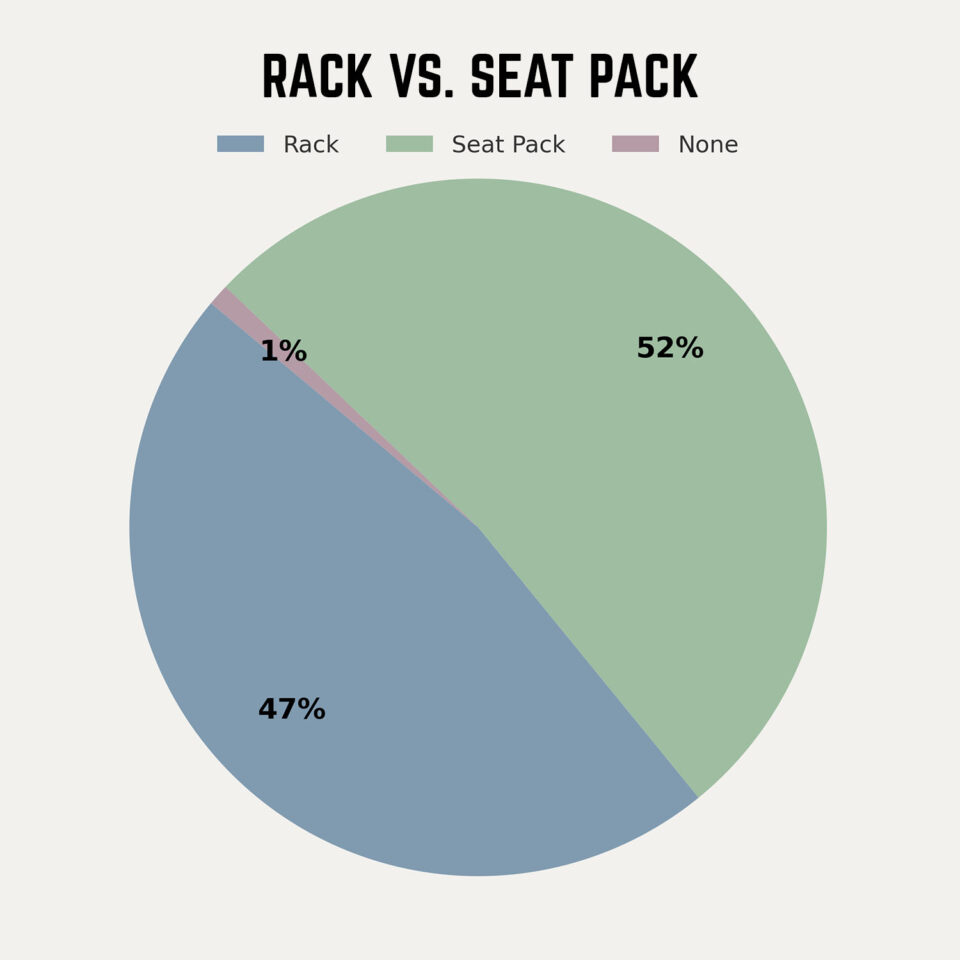
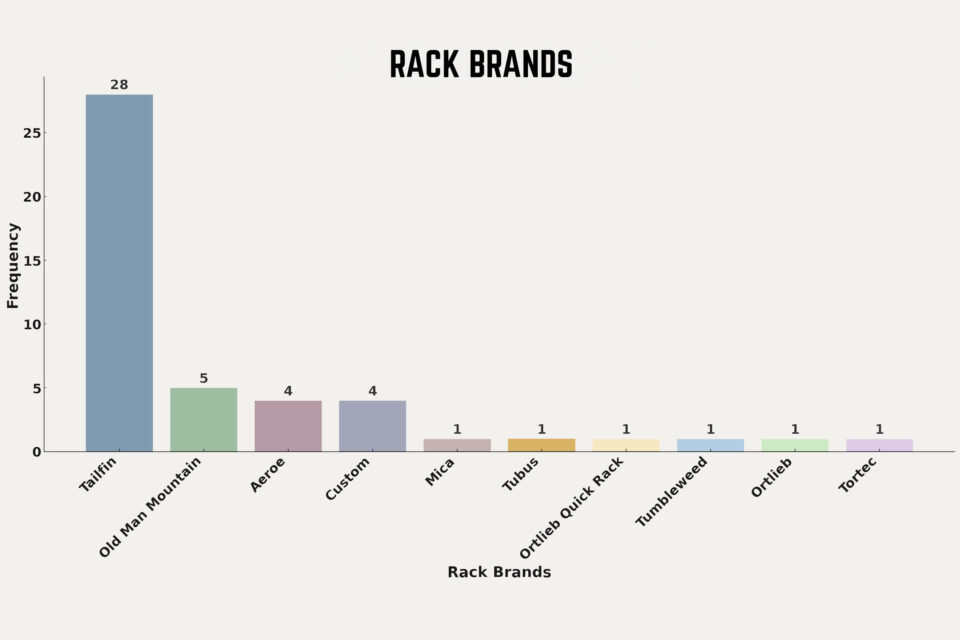
Let’s talk about cargo. This is always an exciting topic, and we’ve seen significant changes over the last few years, especially with the resurgence of the rear rack. This year, 47% of the rigs are equipped with some type of rear rack, with the majority using a Tailfin system of some kind. There are also five Old Man Mountain racks, and various others, including custom racks.
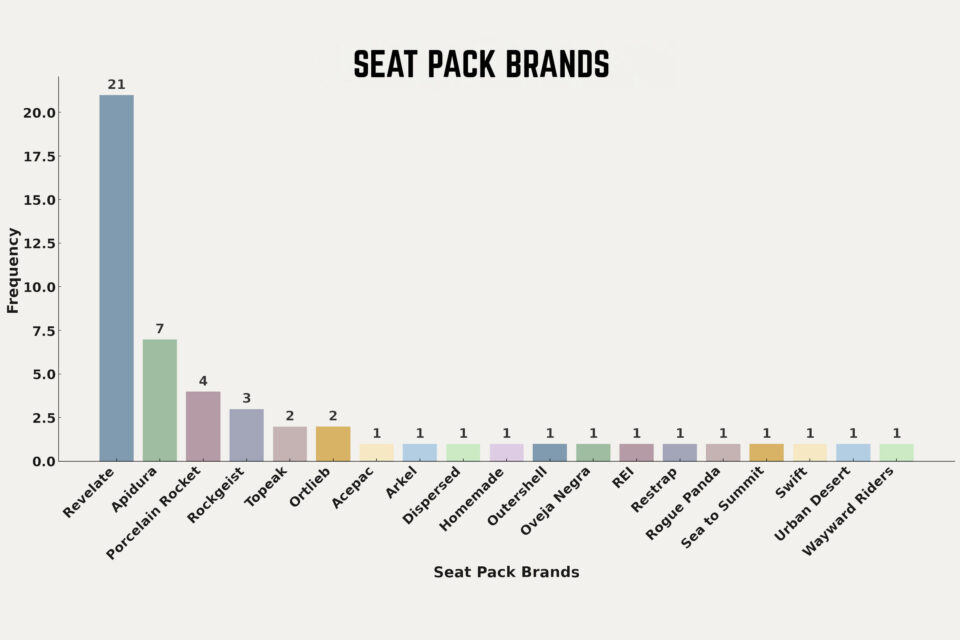
We see 52% of riders choosing to use a seat pack. The most popular brand is Revelate Designs, with 21 riders using their packs, followed by Apidura with seven, and Porcelain Rocket (now made by Rockgeist) with four. There are 20 different seat packs and 10 unique rack setups, including one person using a large trailer.
Regarding brand consistency, 15 bikes use the same brand for all their gear. Of these, seven are using Revelate Designs bags, and while some are sponsored athletes, others are not. I’m always curious see how many people are taking advantage of their cargo forks, and this year, it’s evenly split. Exactly half of the riders are utilizing their fork space for cargo.
Pedals, Seatposts, Dynamo Hubs, and Navigation
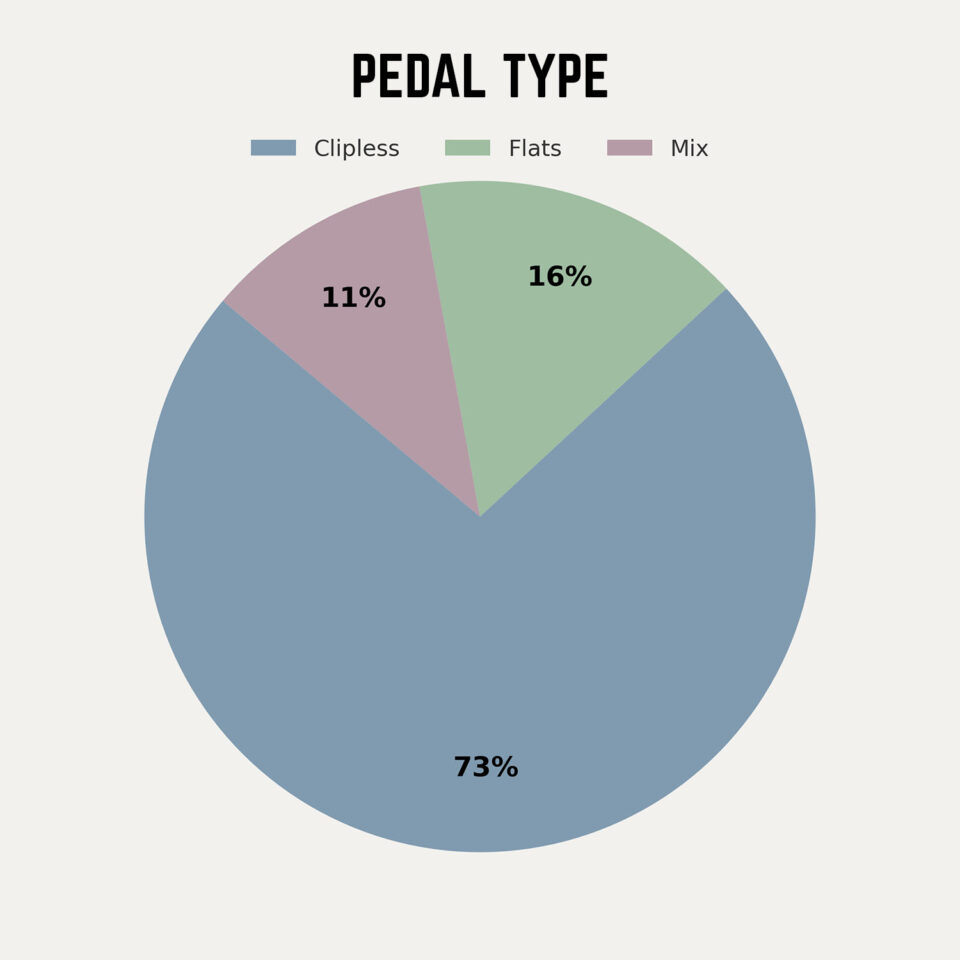
The vast majority of riders are running clipless pedals over flats, with 73 riders riding clipless, 16 on flats, and 11 using a hybrid with flat on one side and clips on the other. Despite the rise of powerful and lightweight cache batteries, dynamo hubs continue to remain popular. We count 68% of riders using a dynamo hub, mostly paired with a dynamo-specific light.
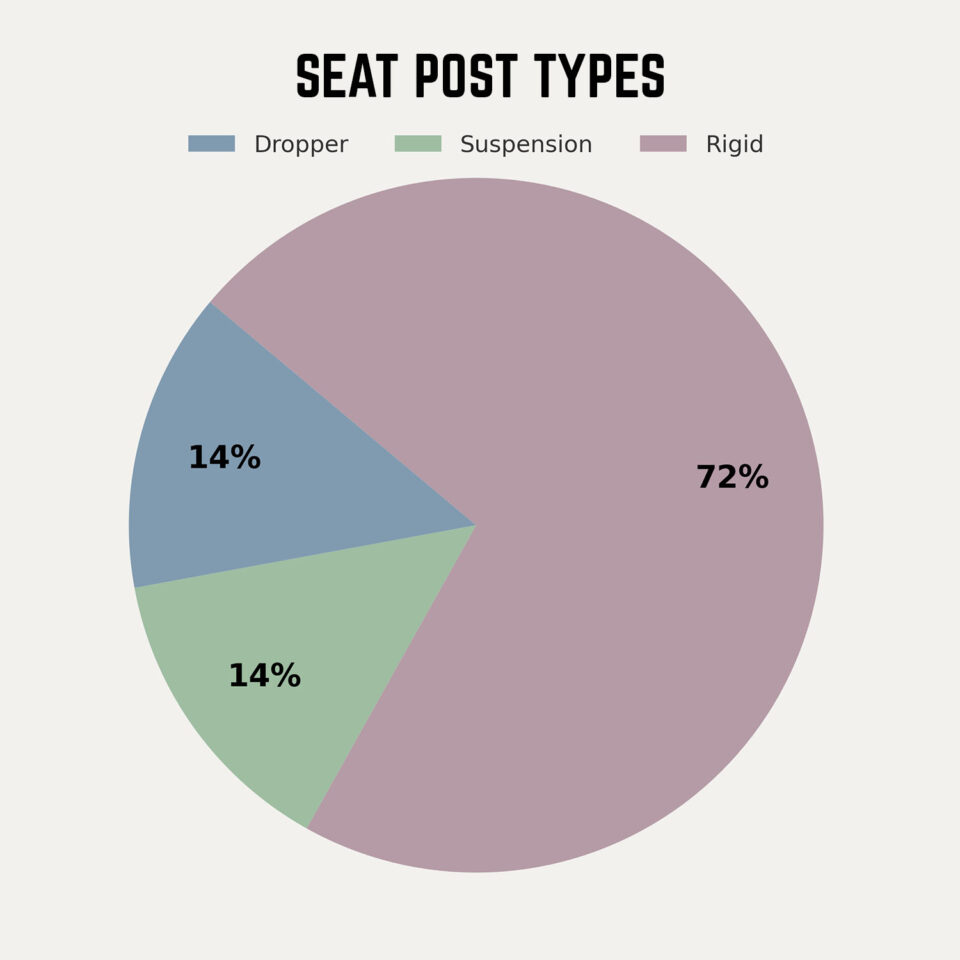
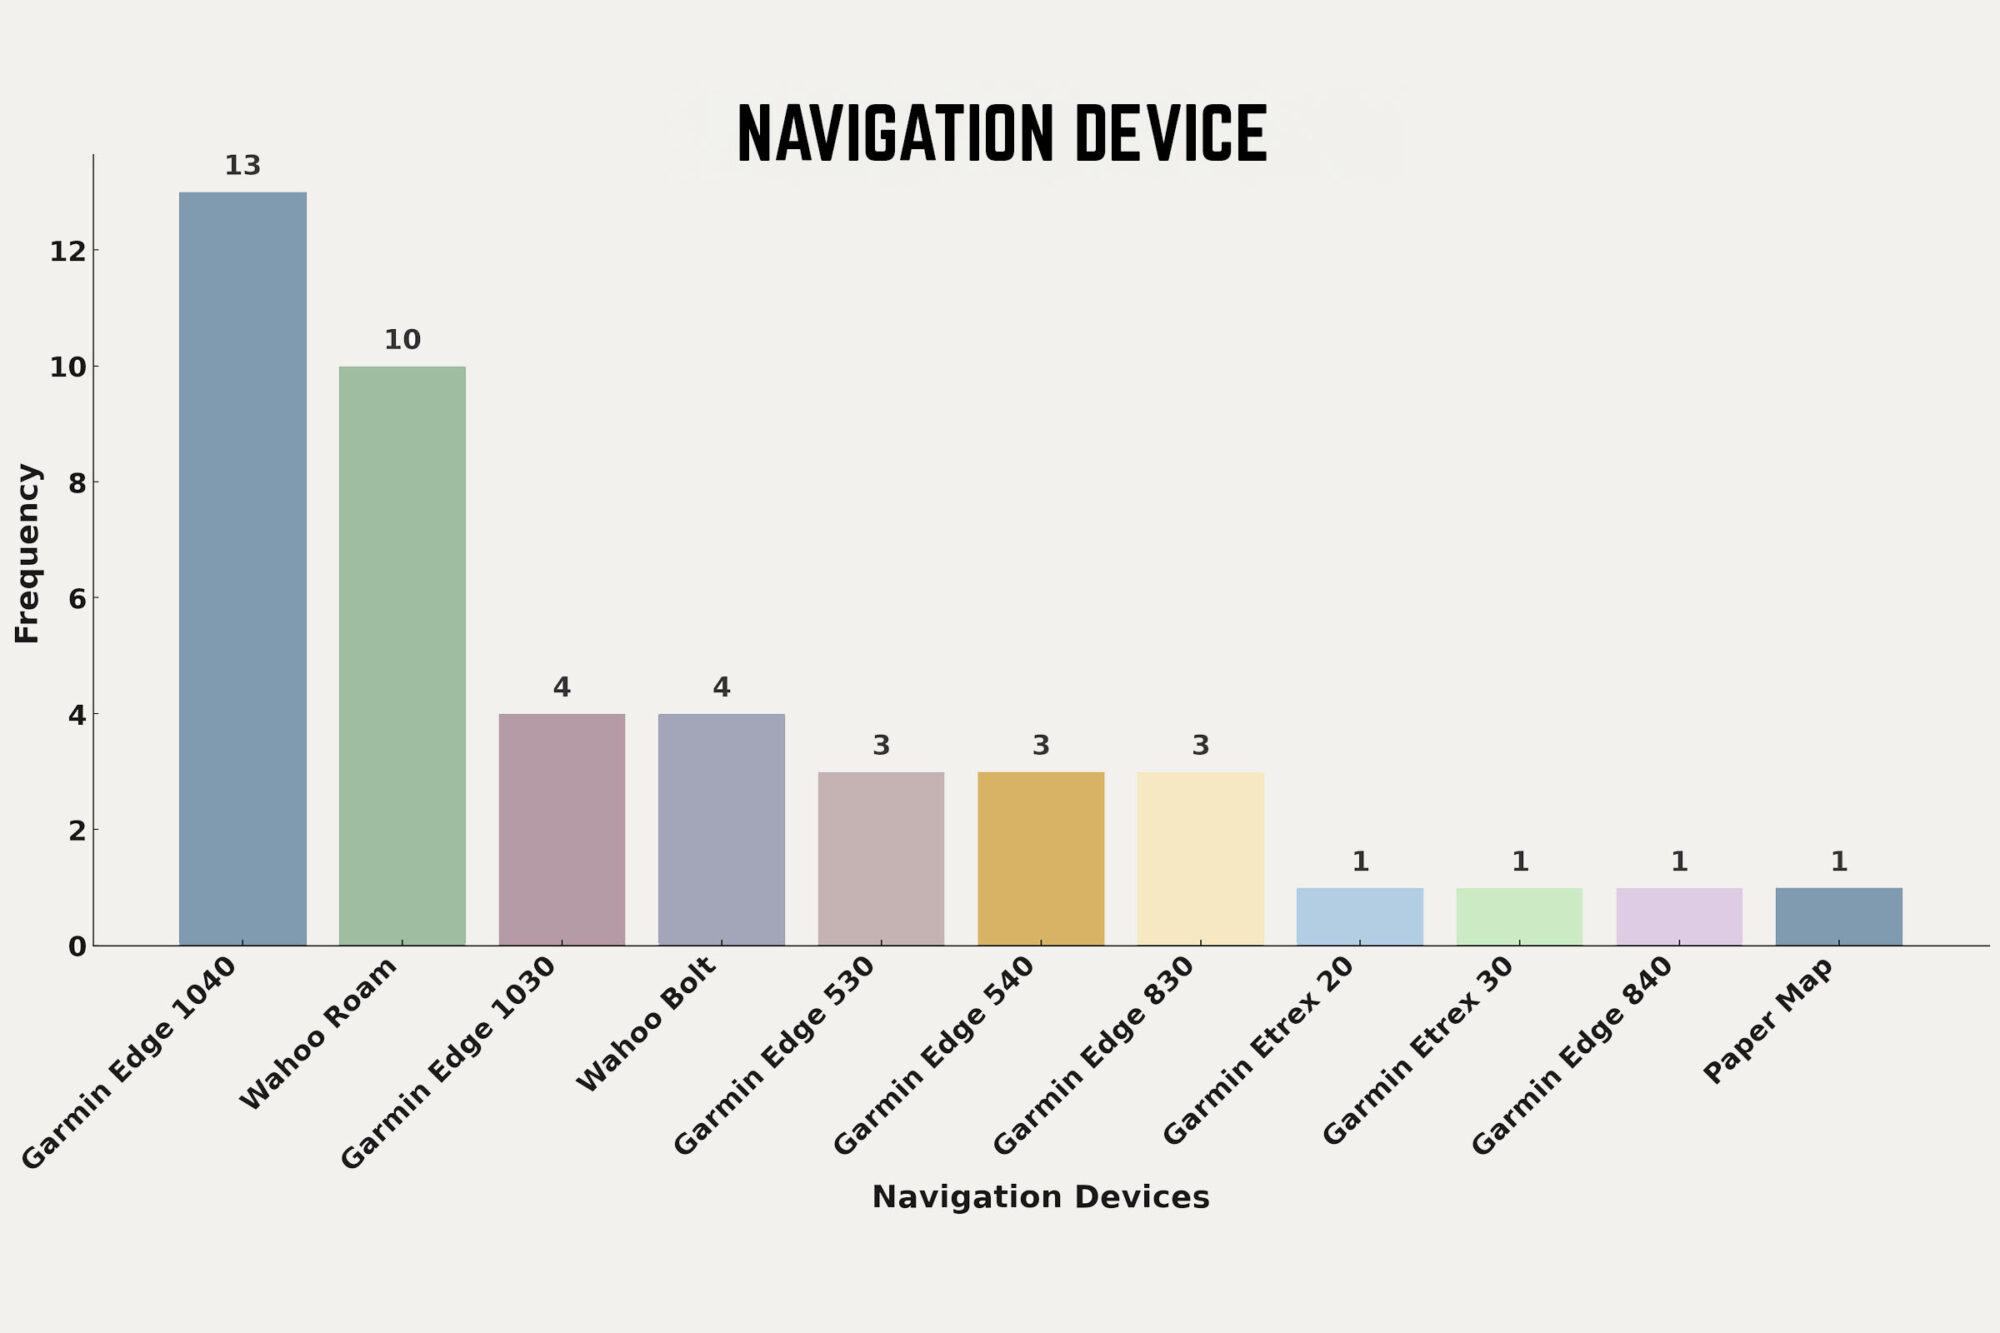
Over half of the riders are using rigid seatposts, while 14 bikes are equipped with dropper posts, and another 14 have suspension seatposts from brands like Cane Creek or Redshift. Although I didn’t specifically ask for it, 44 riders shared their navigation choices. The Garmin Edge 1040 Solar is a favorite, used by 13 riders, followed by the Wahoo Element Roam with 10.
The Riders
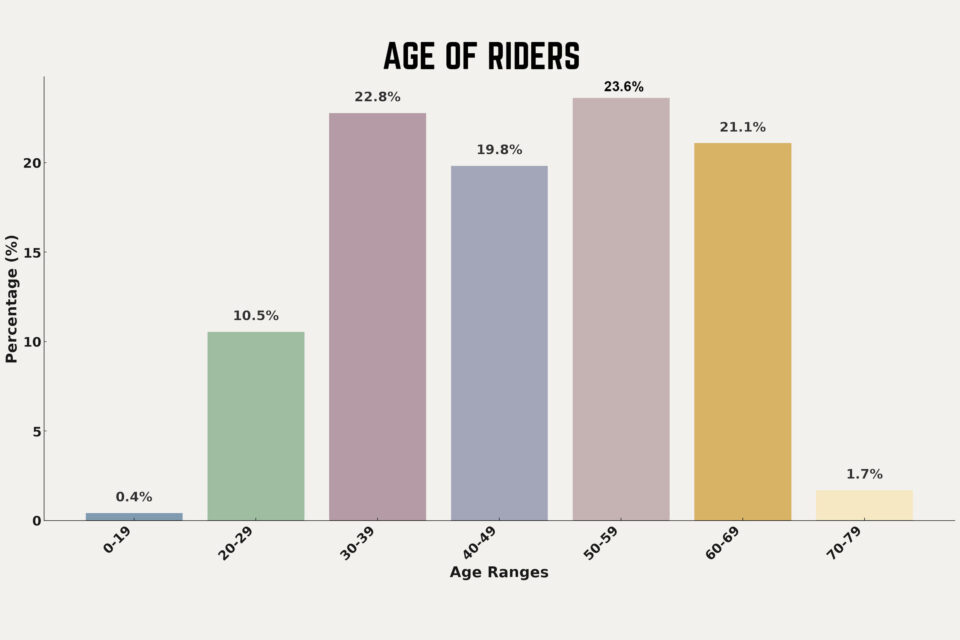
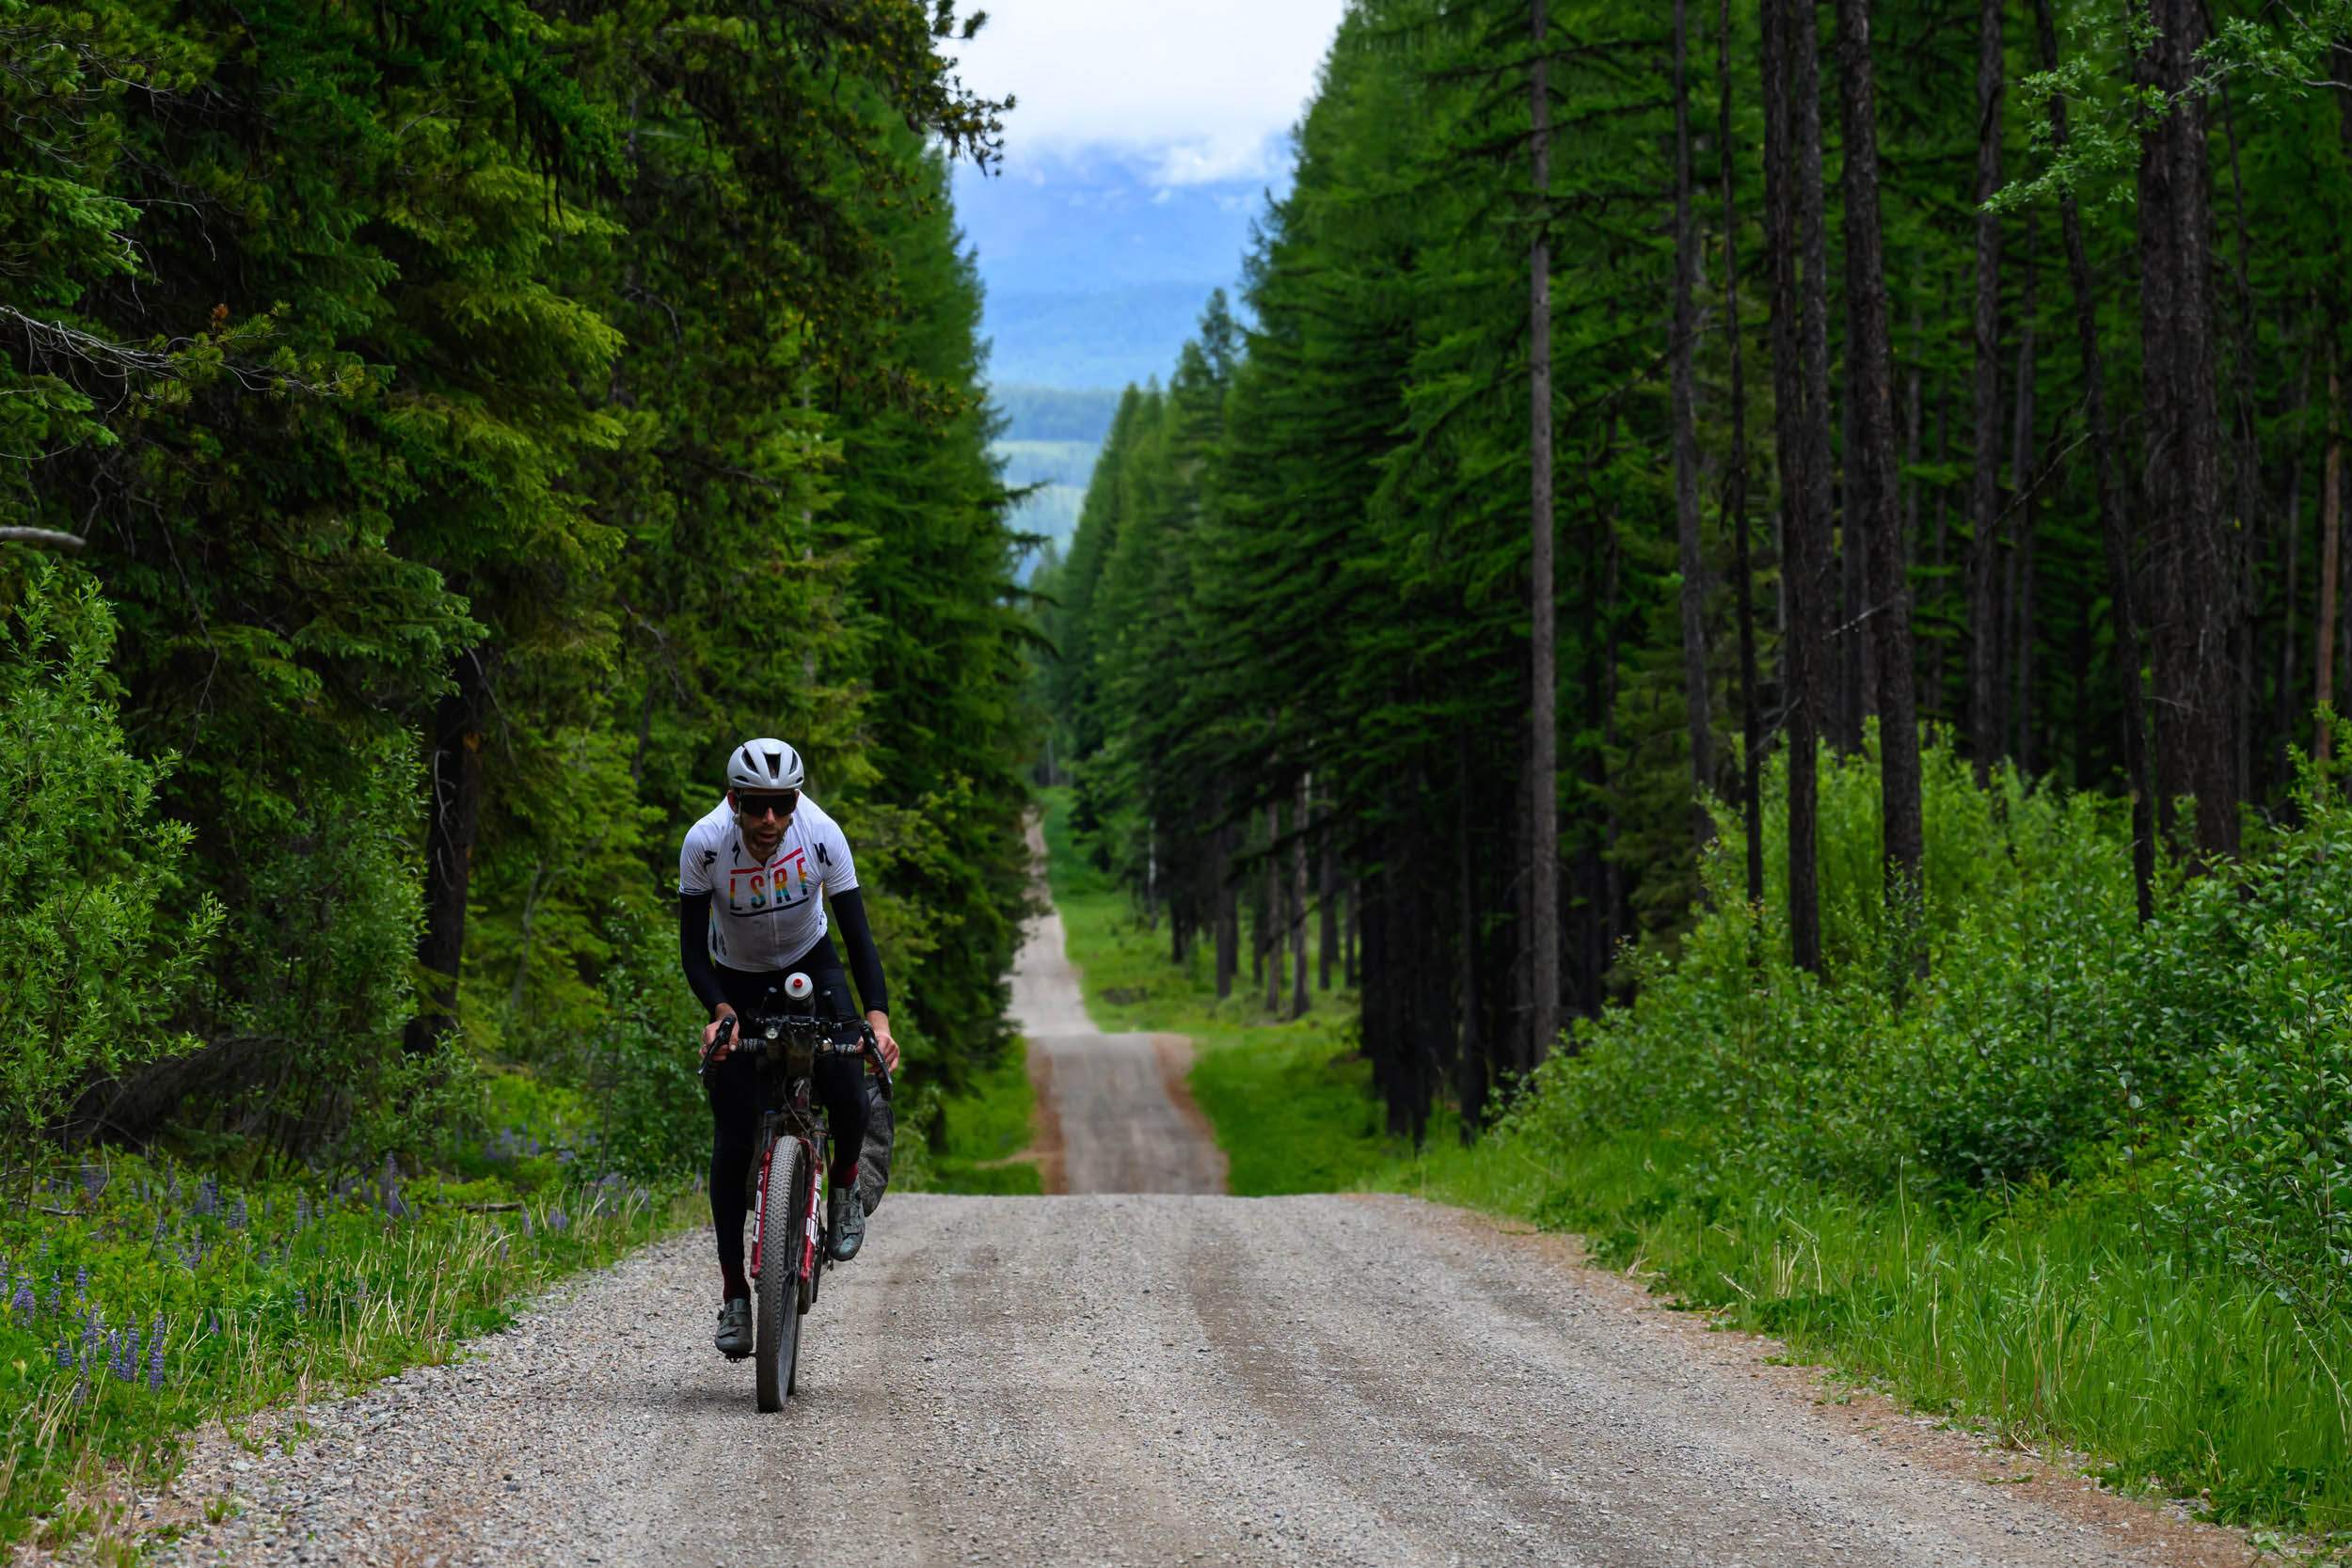
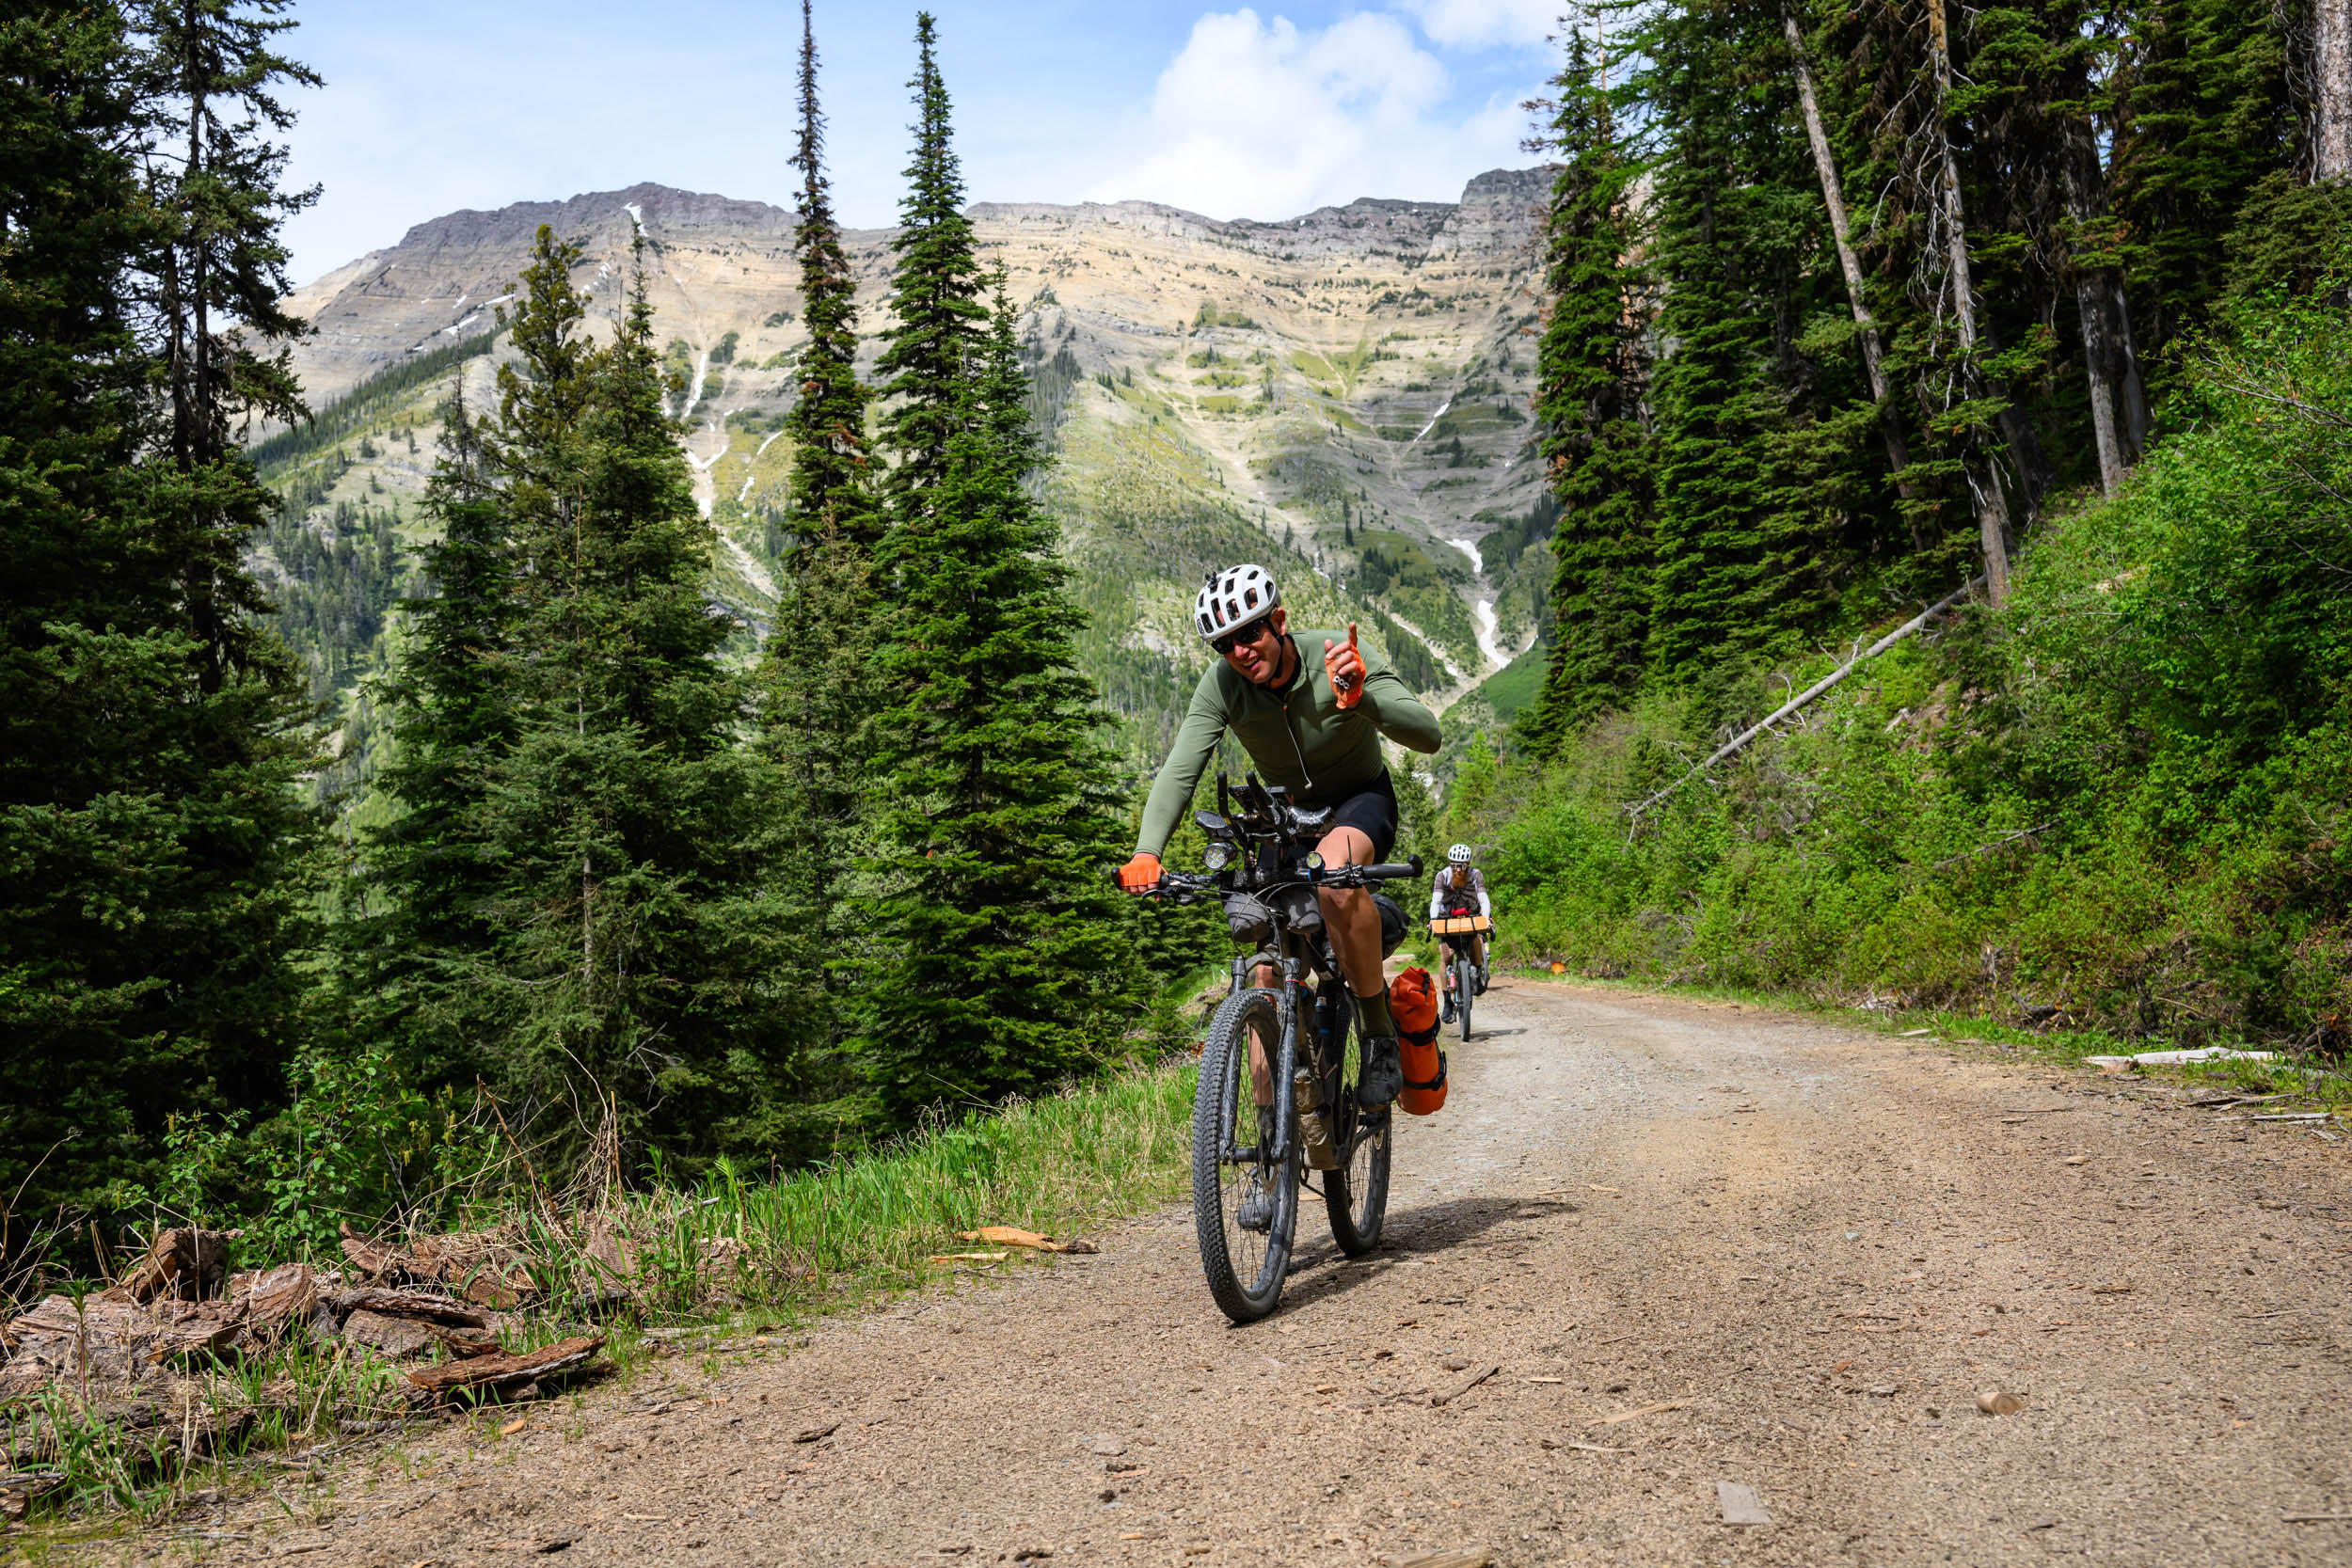
According to Trackleaders, 225 folks have signed up for the 2024 Tour Divide. Unfortunately, there are far fewer women than men—only 21 women, highlighting a significant disparity. The age distribution is always really interesting. The 30s age group had the most participants last year, but this year, the 50-59 age group was the most at 23.6%, the 30s was next at 22.8%, followed by the 60s at 21.1%. Additionally, there was a handful of 70-year-olds and one participant under 20, who is 15-years-old, which is quite impressive. I don’t remember what I was doing at 15, but I’m sure they will not forget this experience.
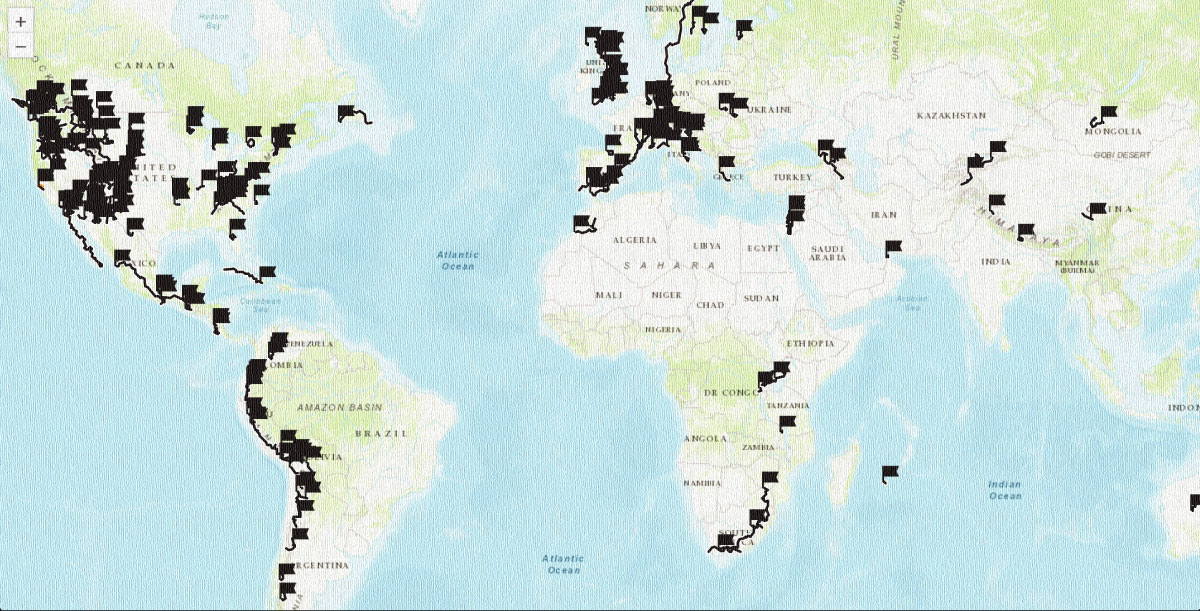
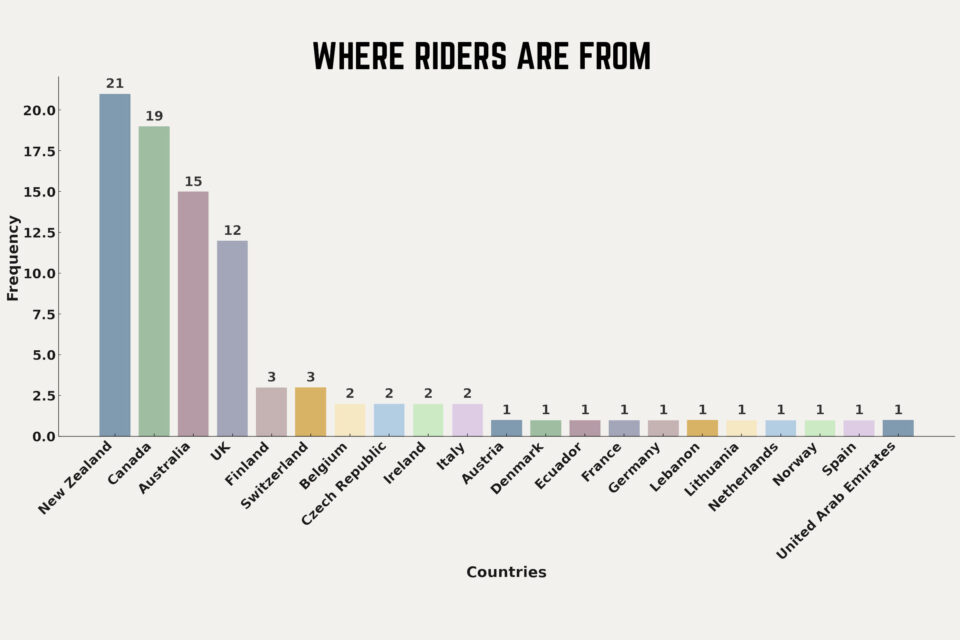
Over the years, the Tour Divide has truly become a diverse race, attracting participants from all over the world. It’s no surprise that the United States is well represented, with 131 individuals coming from the states, the most of which was Colorado, followed by California, but 34 states were represented. Outside of the United States, there were 92 participants from 21 different countries. Most notably, New Zealand has 21 individuals, Canada had 19, Australia at 15, and there were 12 from the UK. There were also folks from the United Arab Emirates, Lebanon, Finland, the Czech Republic, and all over the globe.
Among the information I gathered from the 100 rigs, 77 of those individuals are considered rookies, meaning they had never pedaled the Tour Divide before. There were also ten individuals who had started the race previously but did not finish, and 13 veterans who are returning, a few of whom have completed the race more than once, which is always awesome to see.
Okay, that wraps it up for this year. What do you think about these numbers? Does anything stand out to you? Is there a specific statistic you’d like to see included next year? Let me know in the comments below!
Further Reading
Make sure to dig into these related articles for more info...
Please keep the conversation civil, constructive, and inclusive, or your comment will be removed.

