
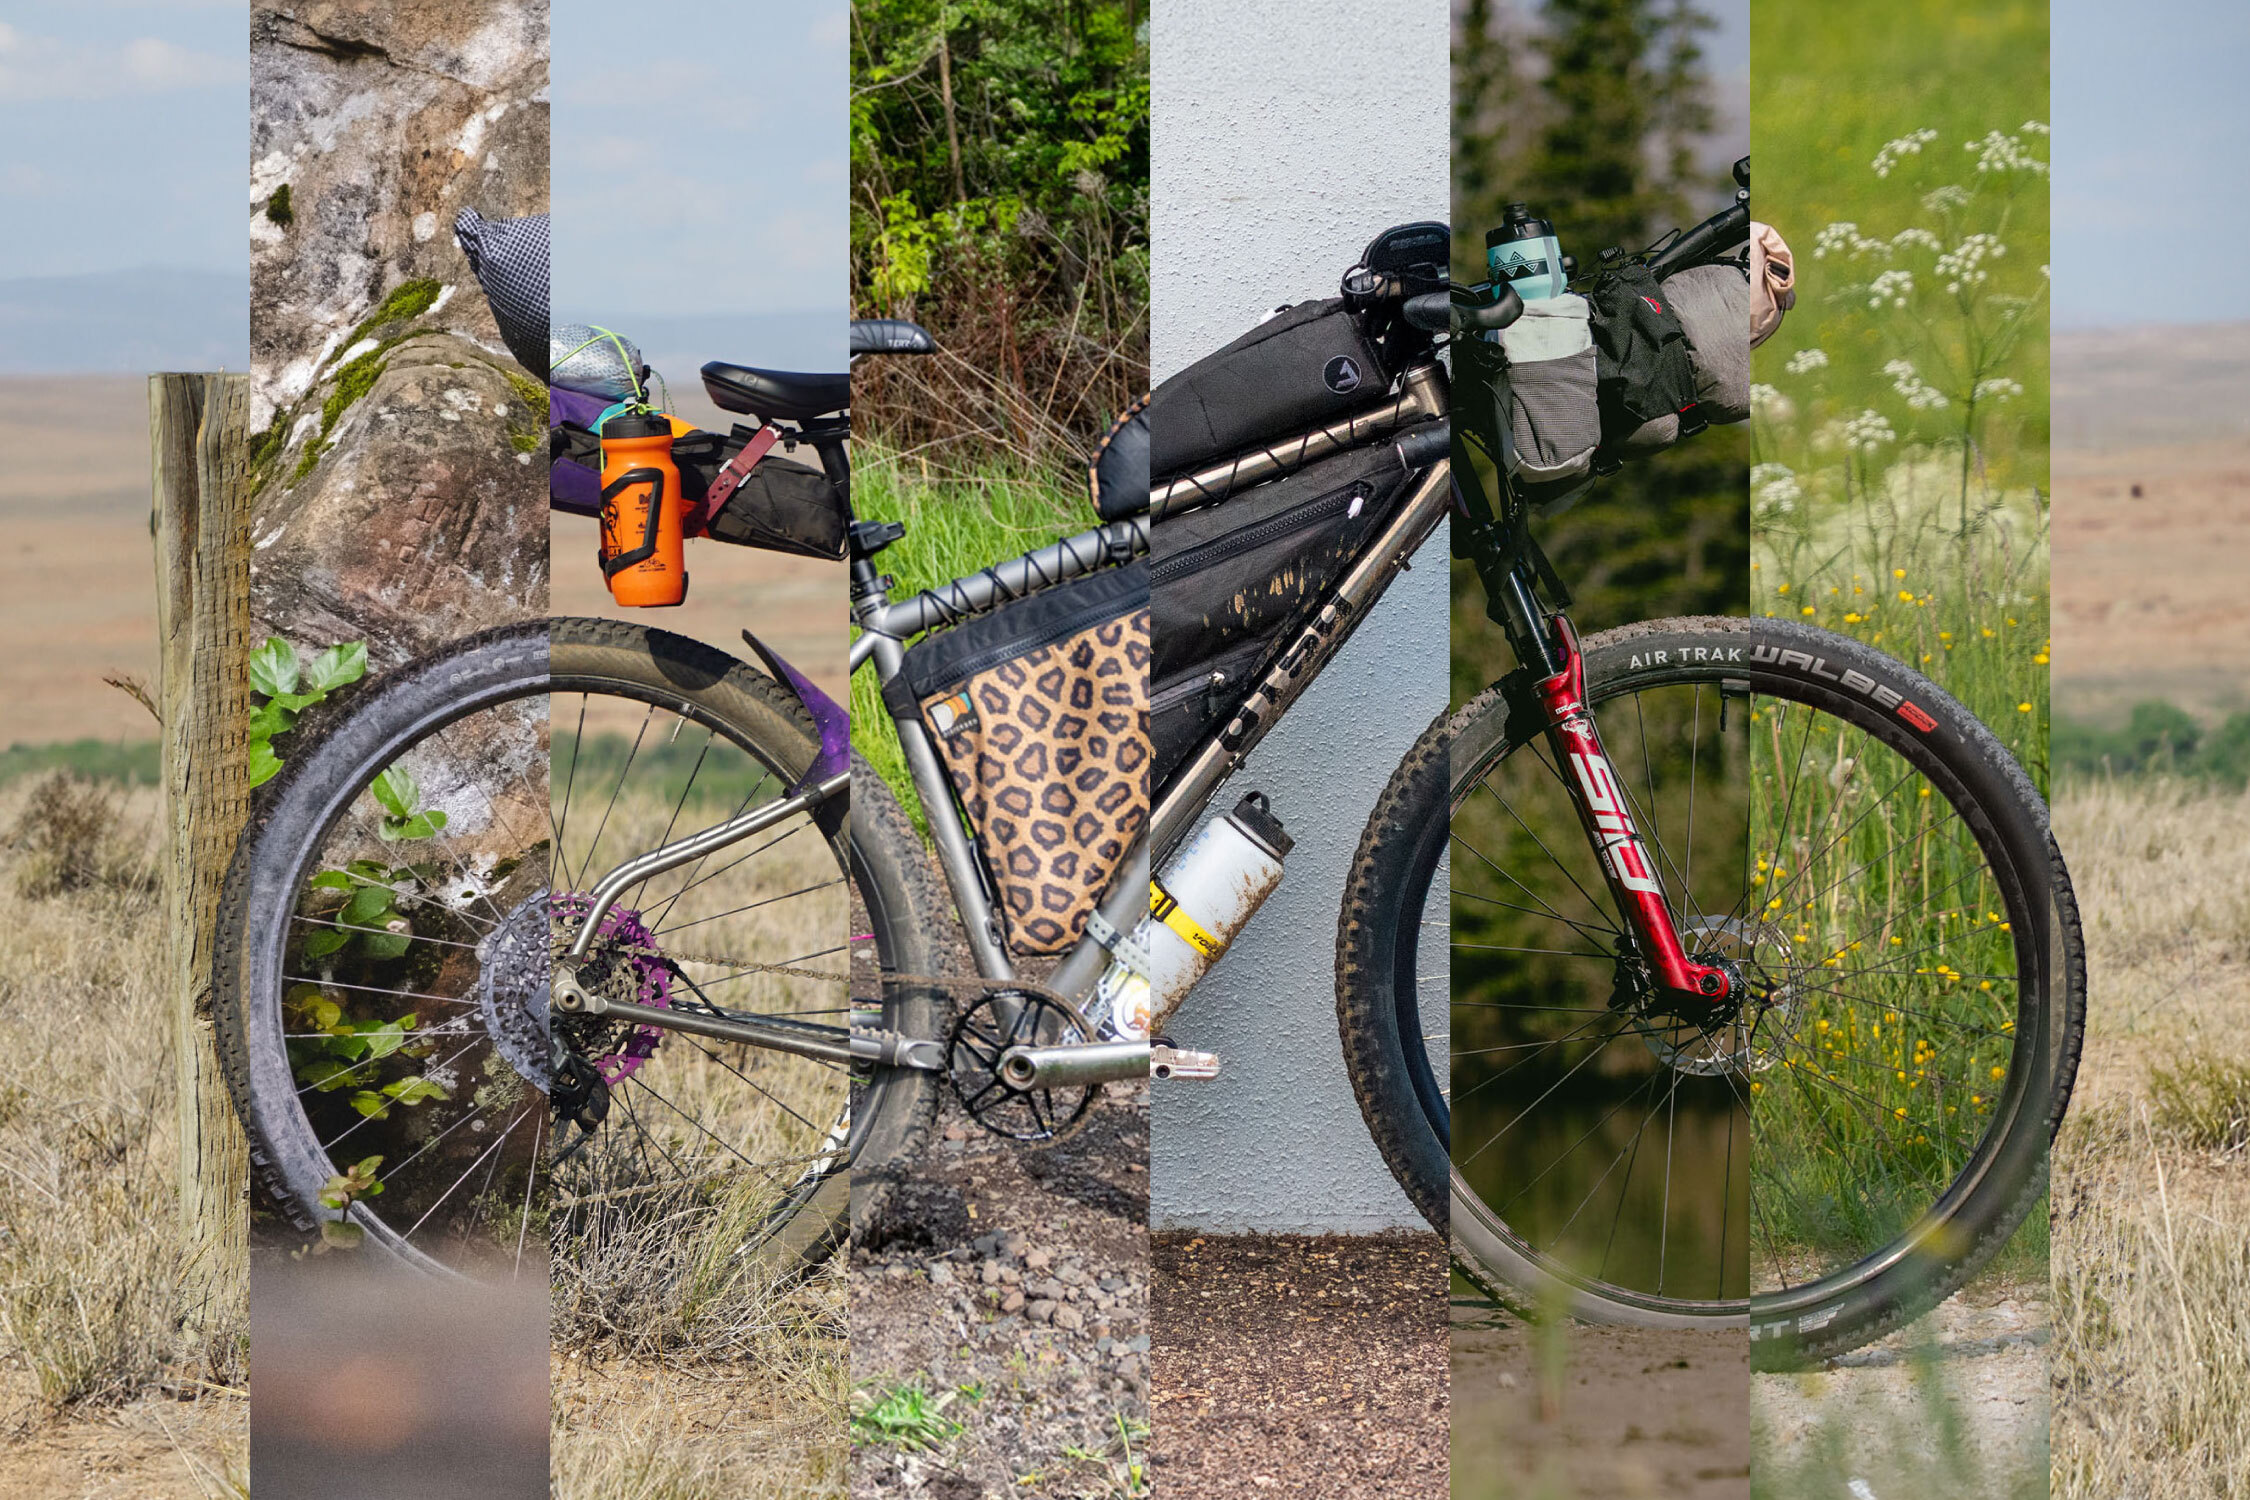
Rigs of the 2025 Tour Divide Stats Analysis


After we published our Rigs of the 2025 Tour Divide, Neil dug into the submissions, uncovering the essential details and trends to reveal a clearer picture of the bikes and gear used in this year’s event. In this piece, we break down the data and highlight some interesting findings, including where folks are from, what bikes, tires, drivetrains, gearing, and cargo setups they’re running, and much more. Dive in here…
PUBLISHED Jun 20, 2025

Well, it’s that time of year again. I scoured 116 Tour Divide rigs this year, dissecting everything from rider location, drivetrains, tires, bags, GPS units, dynamo lights, and more. In my latest video, I dive deep into the data. Watch it below, followed by a written version with photos and charts illustrating the major trends. Let’s have some fun.
The two-part Rigs of the Tour Divide roundup was our largest one to date this year, and I simply couldn’t cover all of the. There were a whopping 168 submissions between flat-bar and drop-bar bikes, and I managed to get through 116 of them. Frankly, it took days to get through, even with technology helping me out. Honestly, most of that time was spent counting chainring sizes or figuring out tire widths because many riders didn’t share that info. But that’s okay. That’s why I put in the time, so you don’t have to!
Bikes
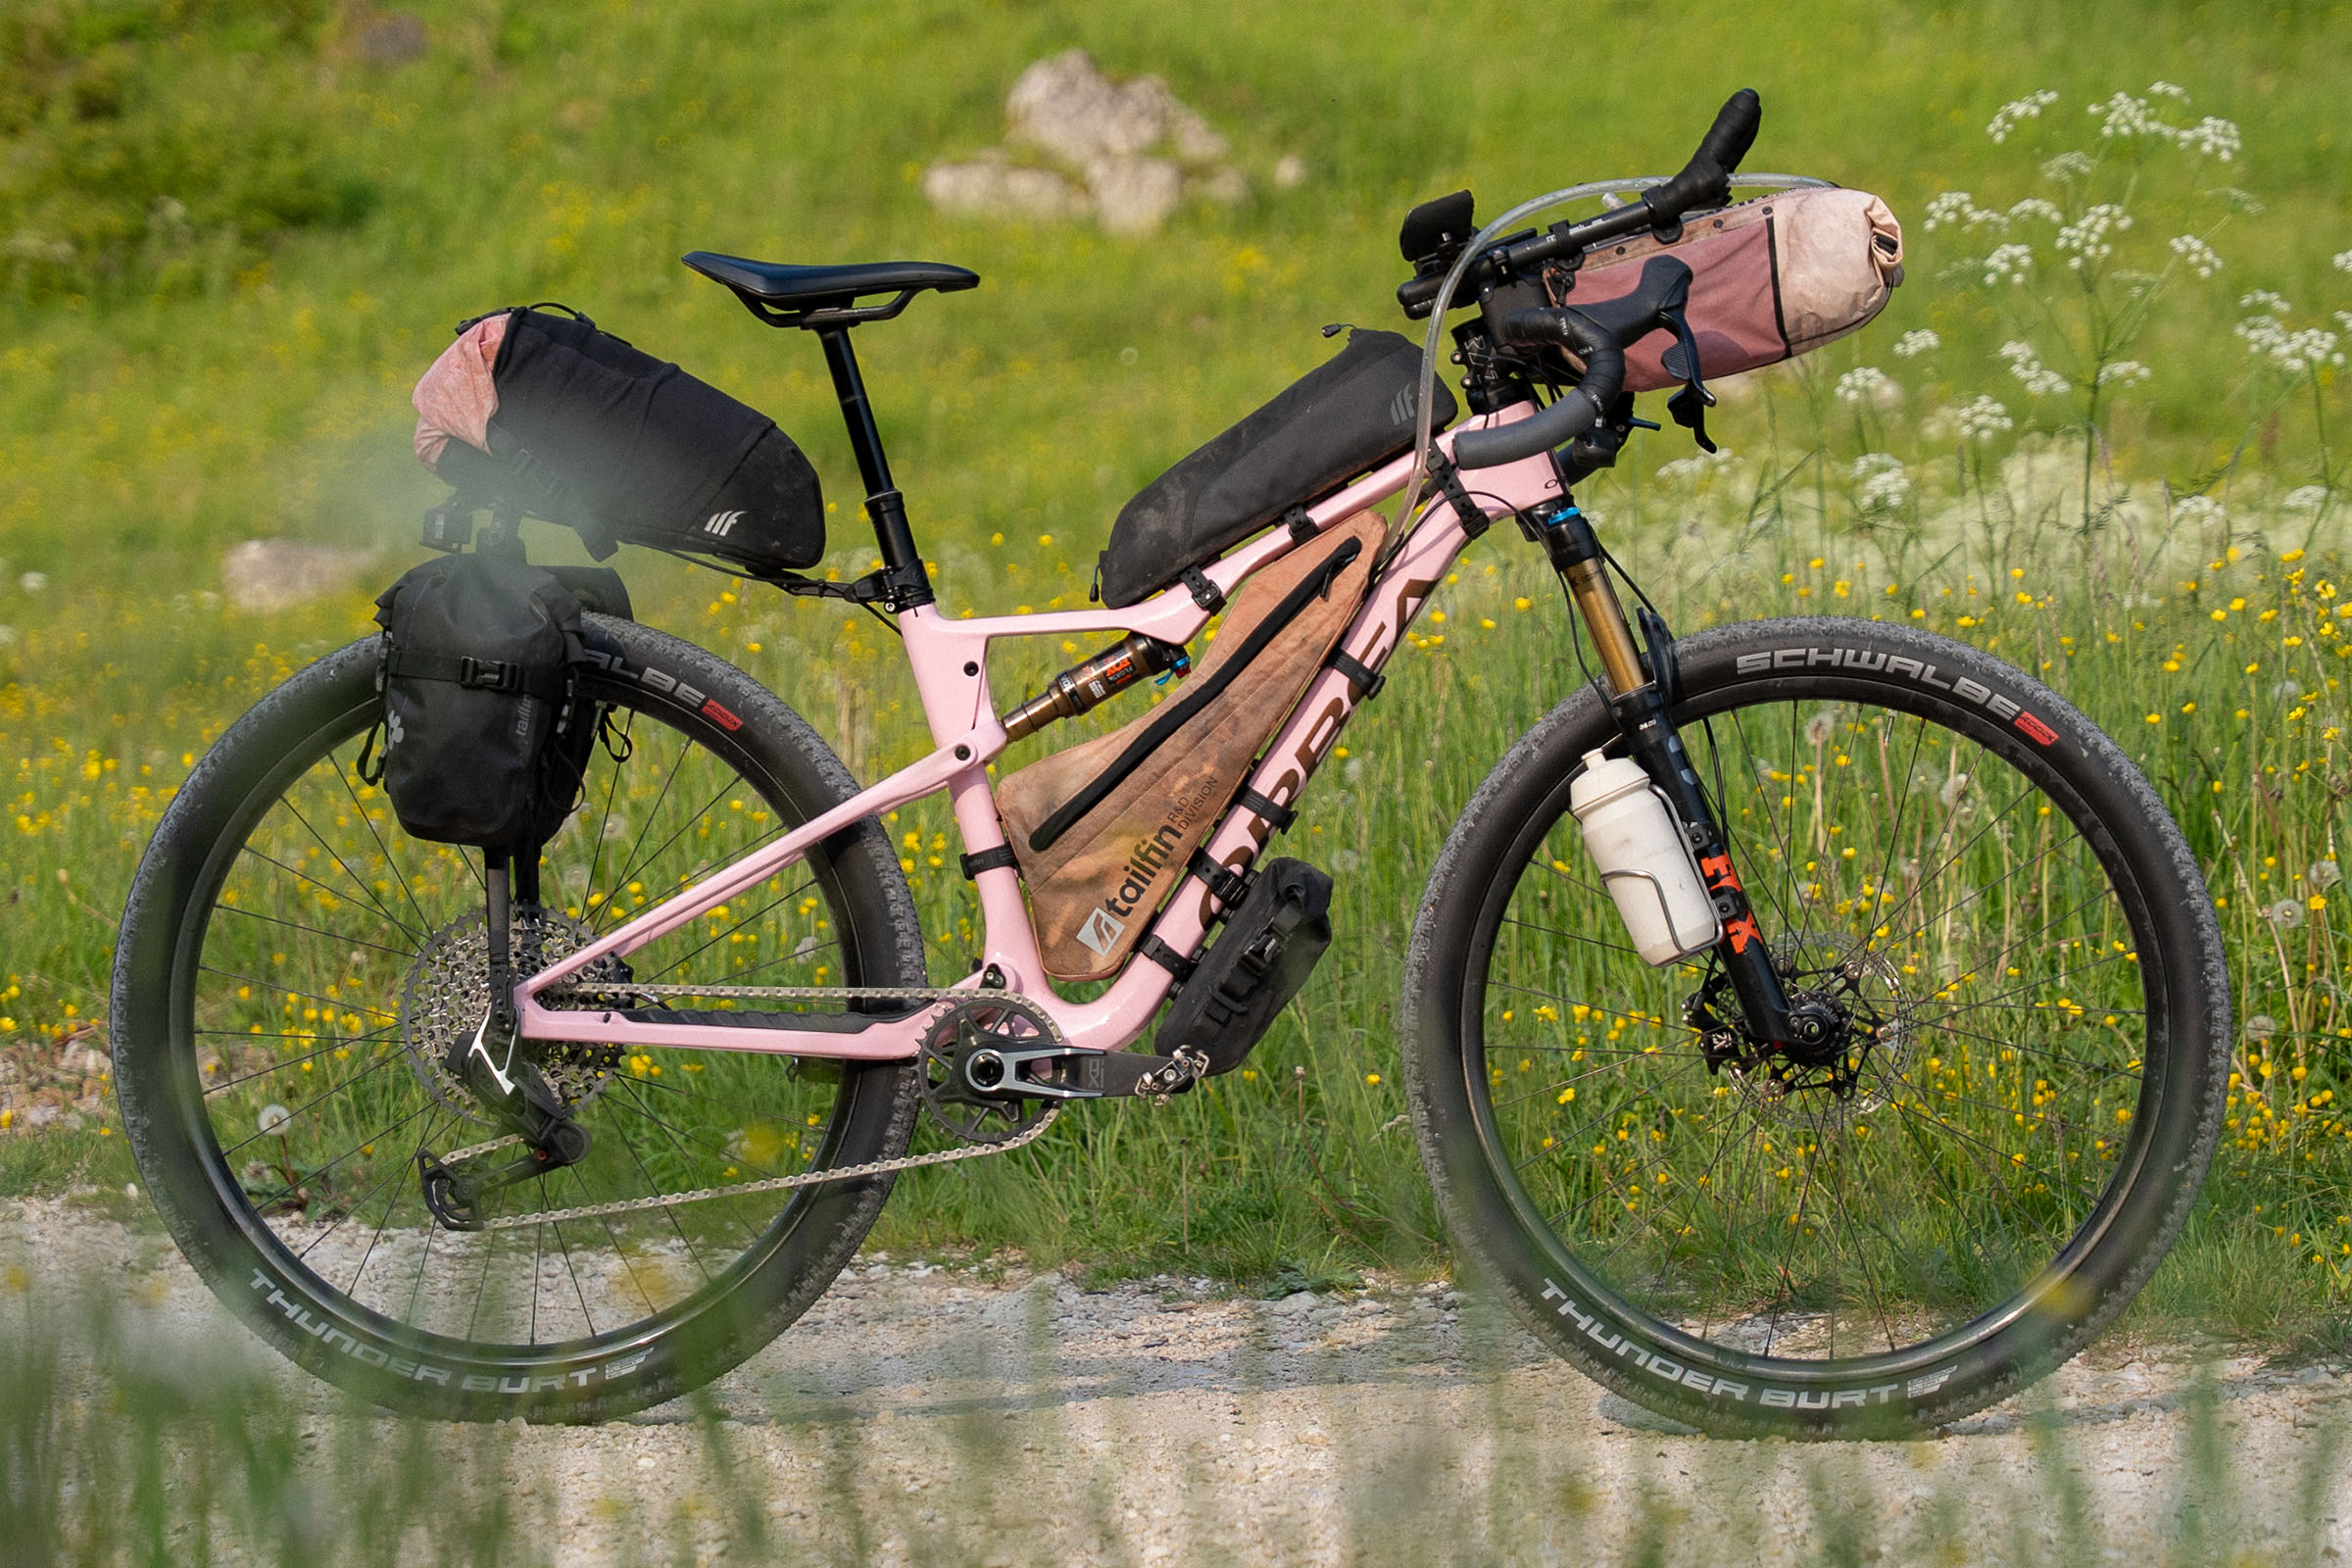
To start, I counted the number of drop-bar and flat-bar bikes and organized my data based on that. In total, our rigs list had 96 flat-bar setups and 72 drop-bar rigs. That’s roughly 57 percent flat bars and 43 percent drop bars—a slight increase in flat bars over last year’s 54/46 split. Of those bikes, 59 had suspension forks, 44 were fully rigid, and 13 were full-suspension setups. One of those was a drop-bar full-suspension rig.
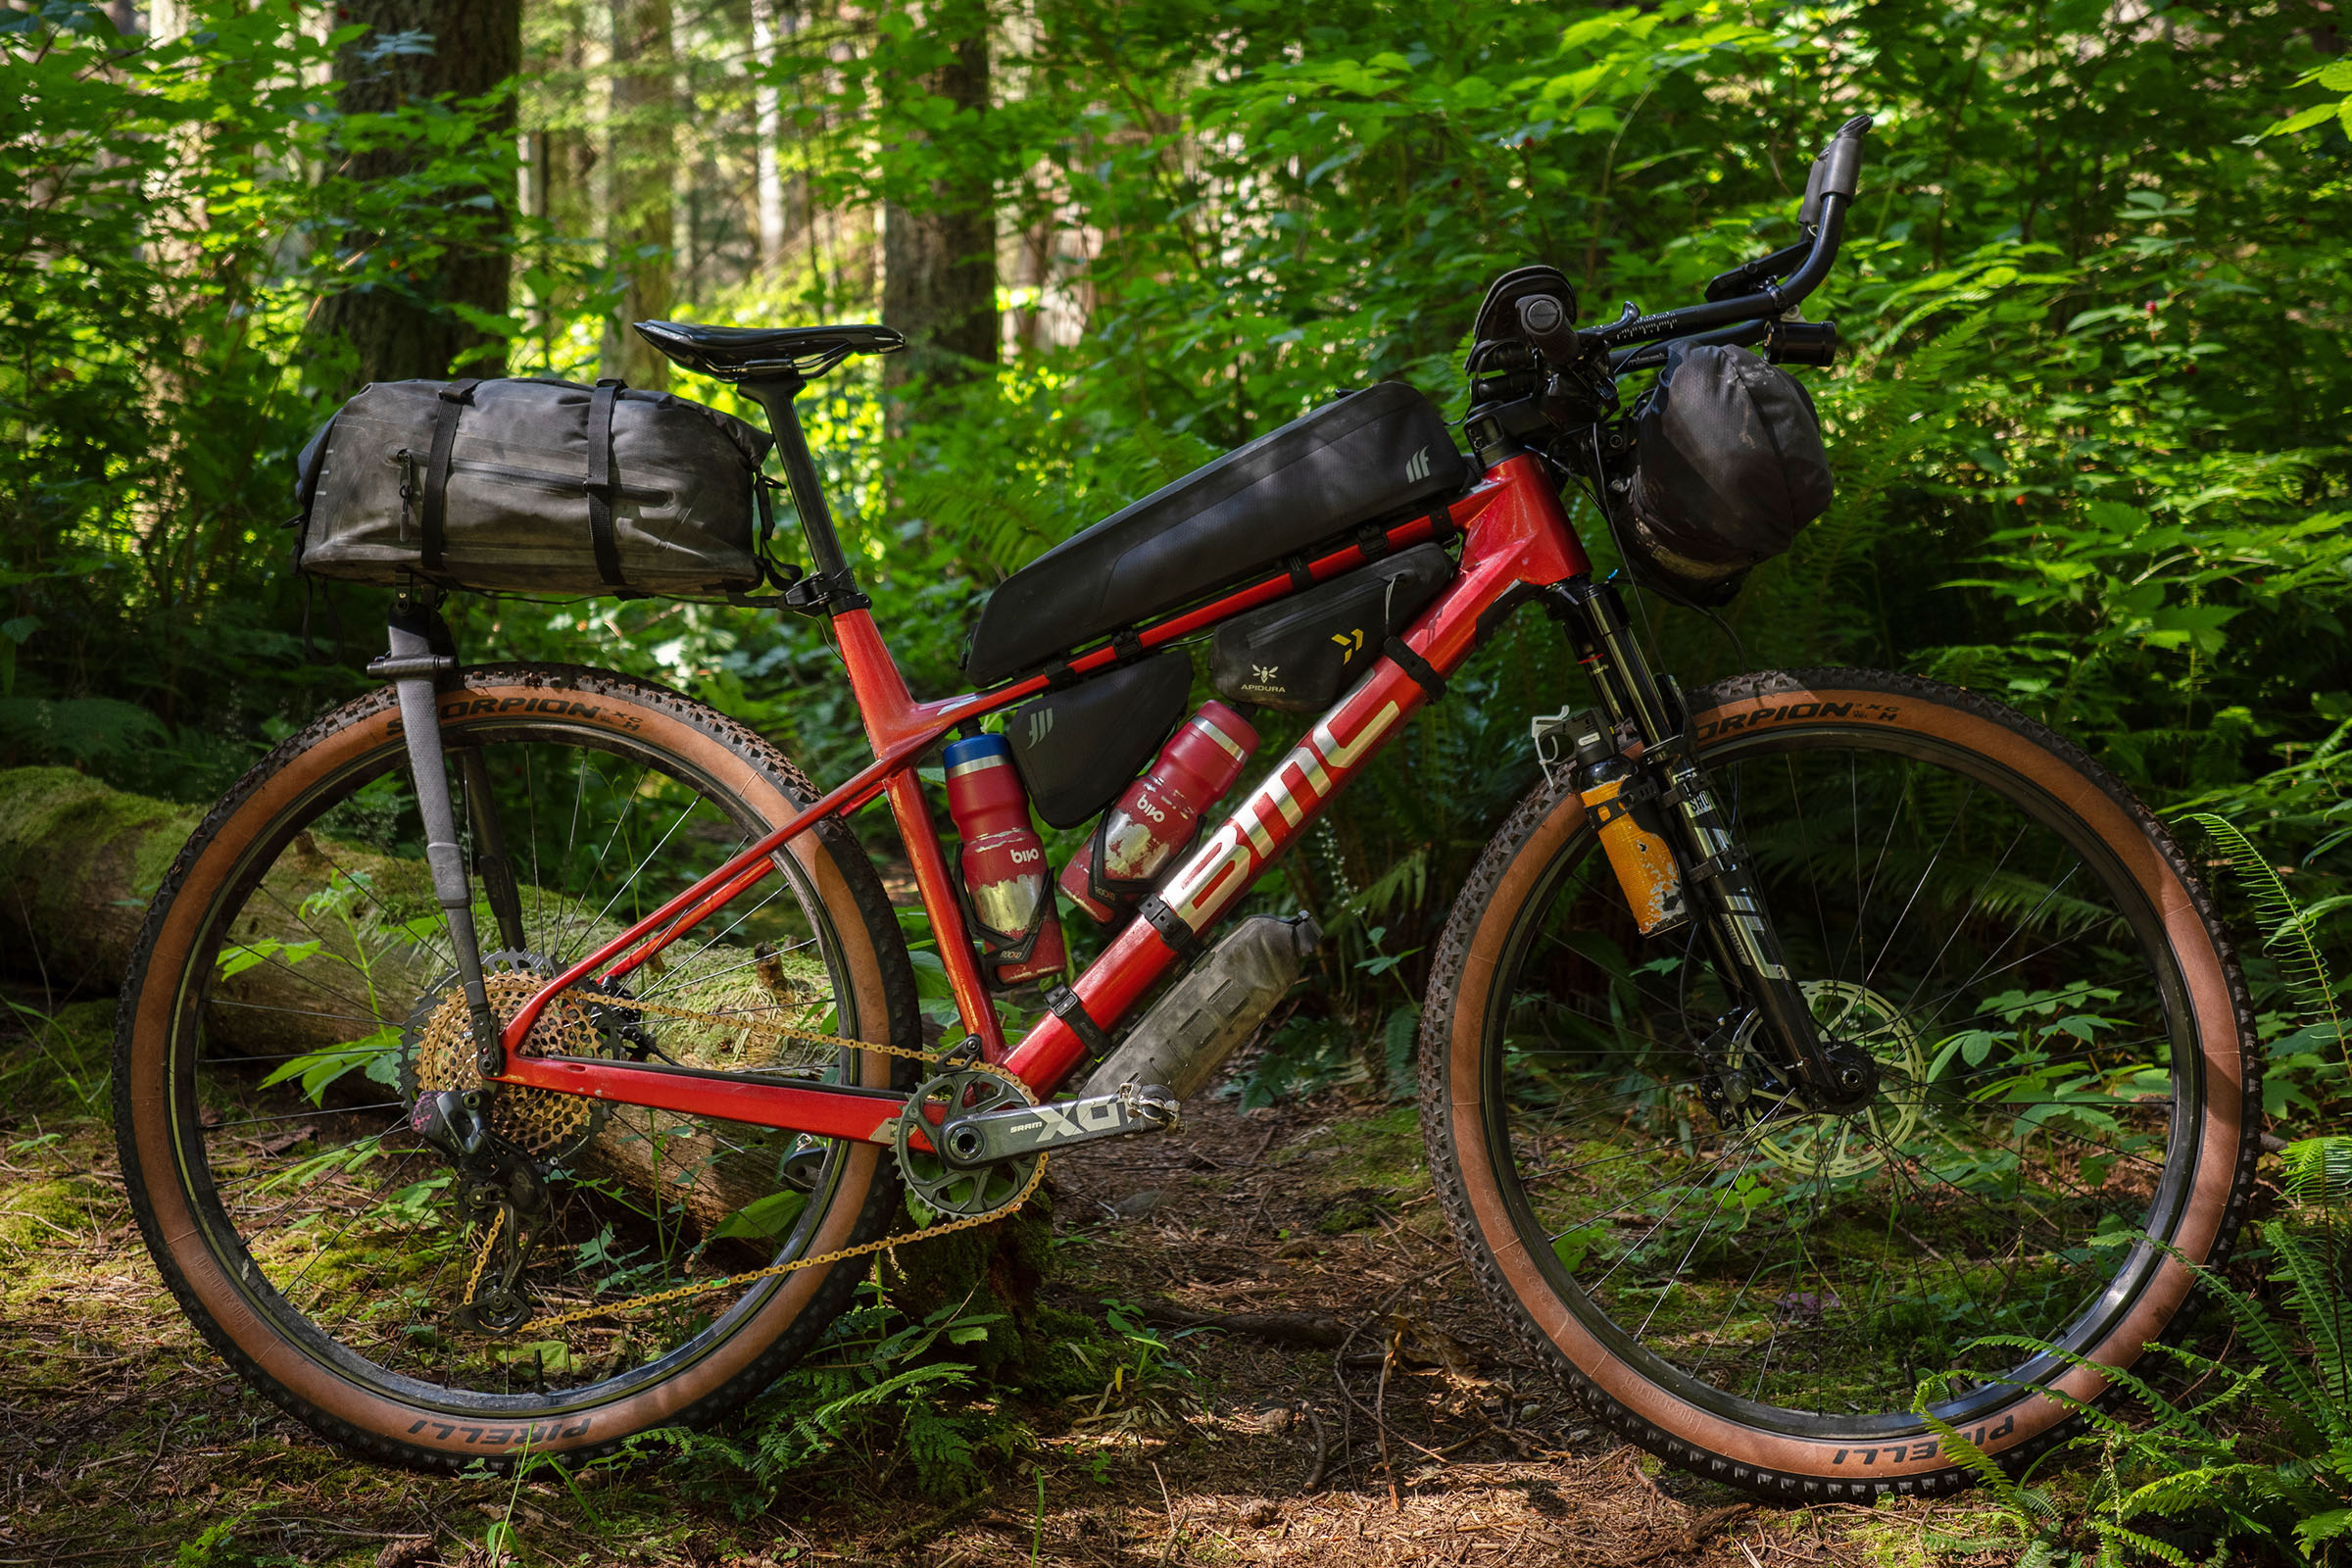
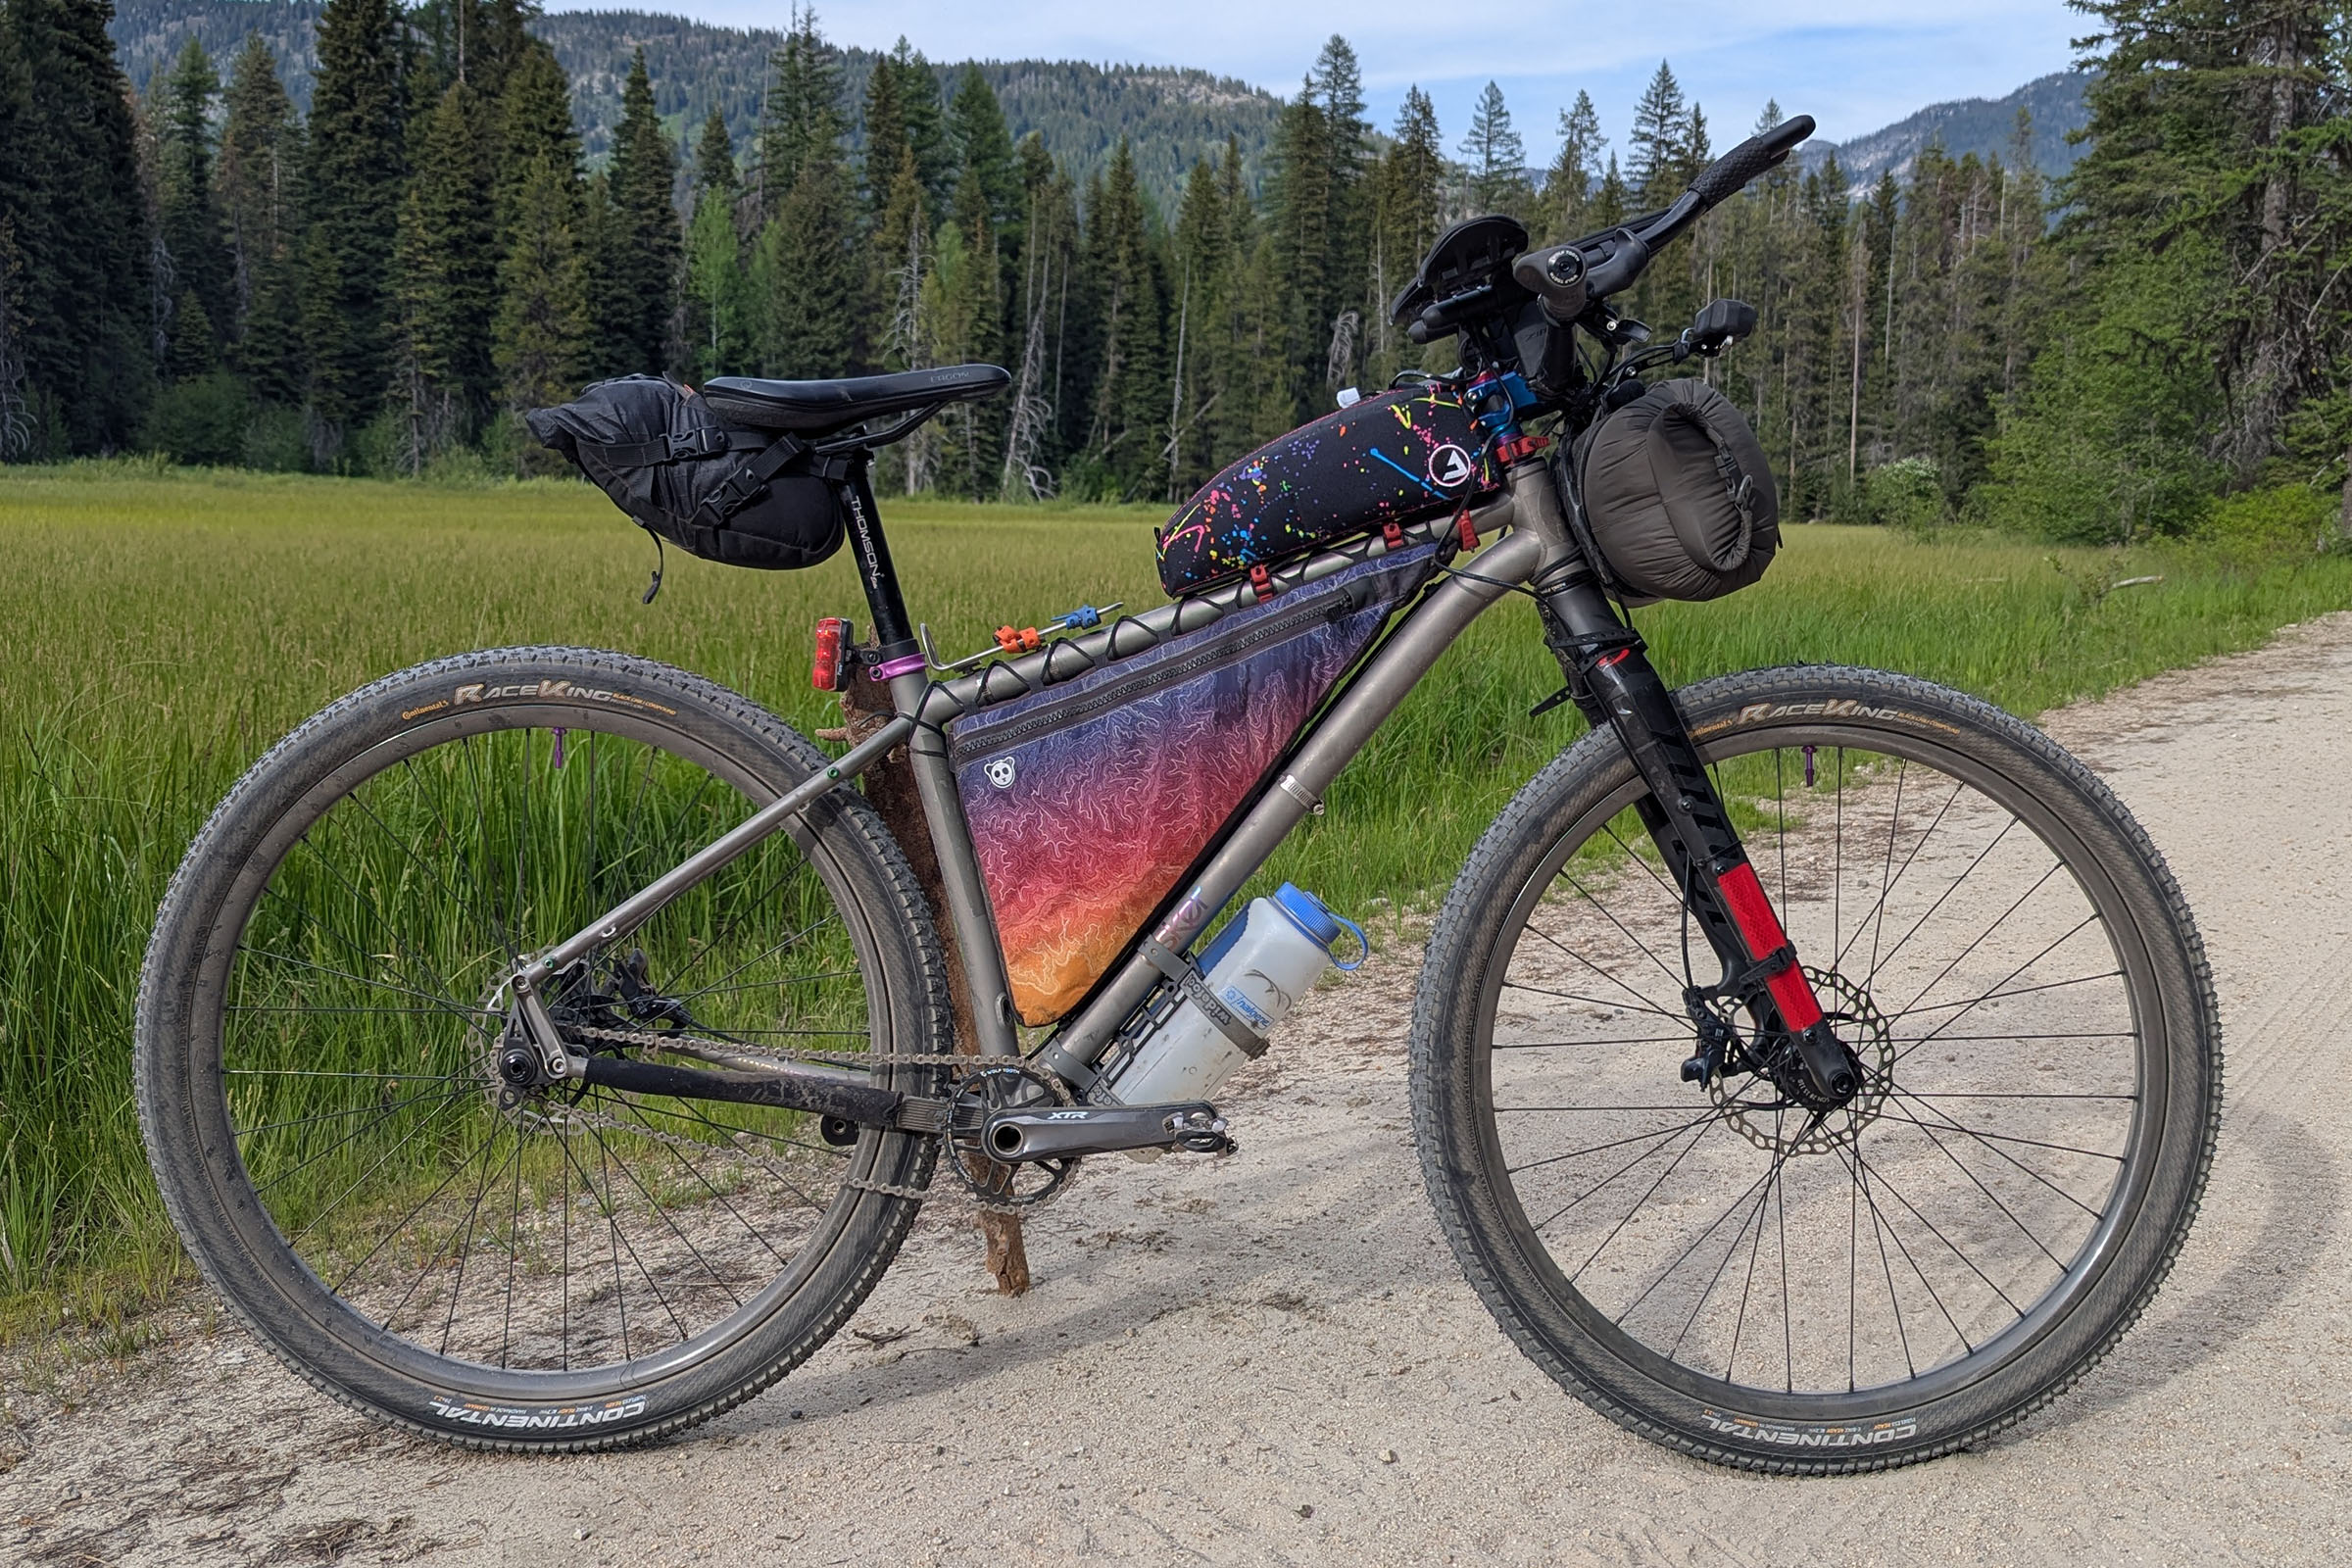
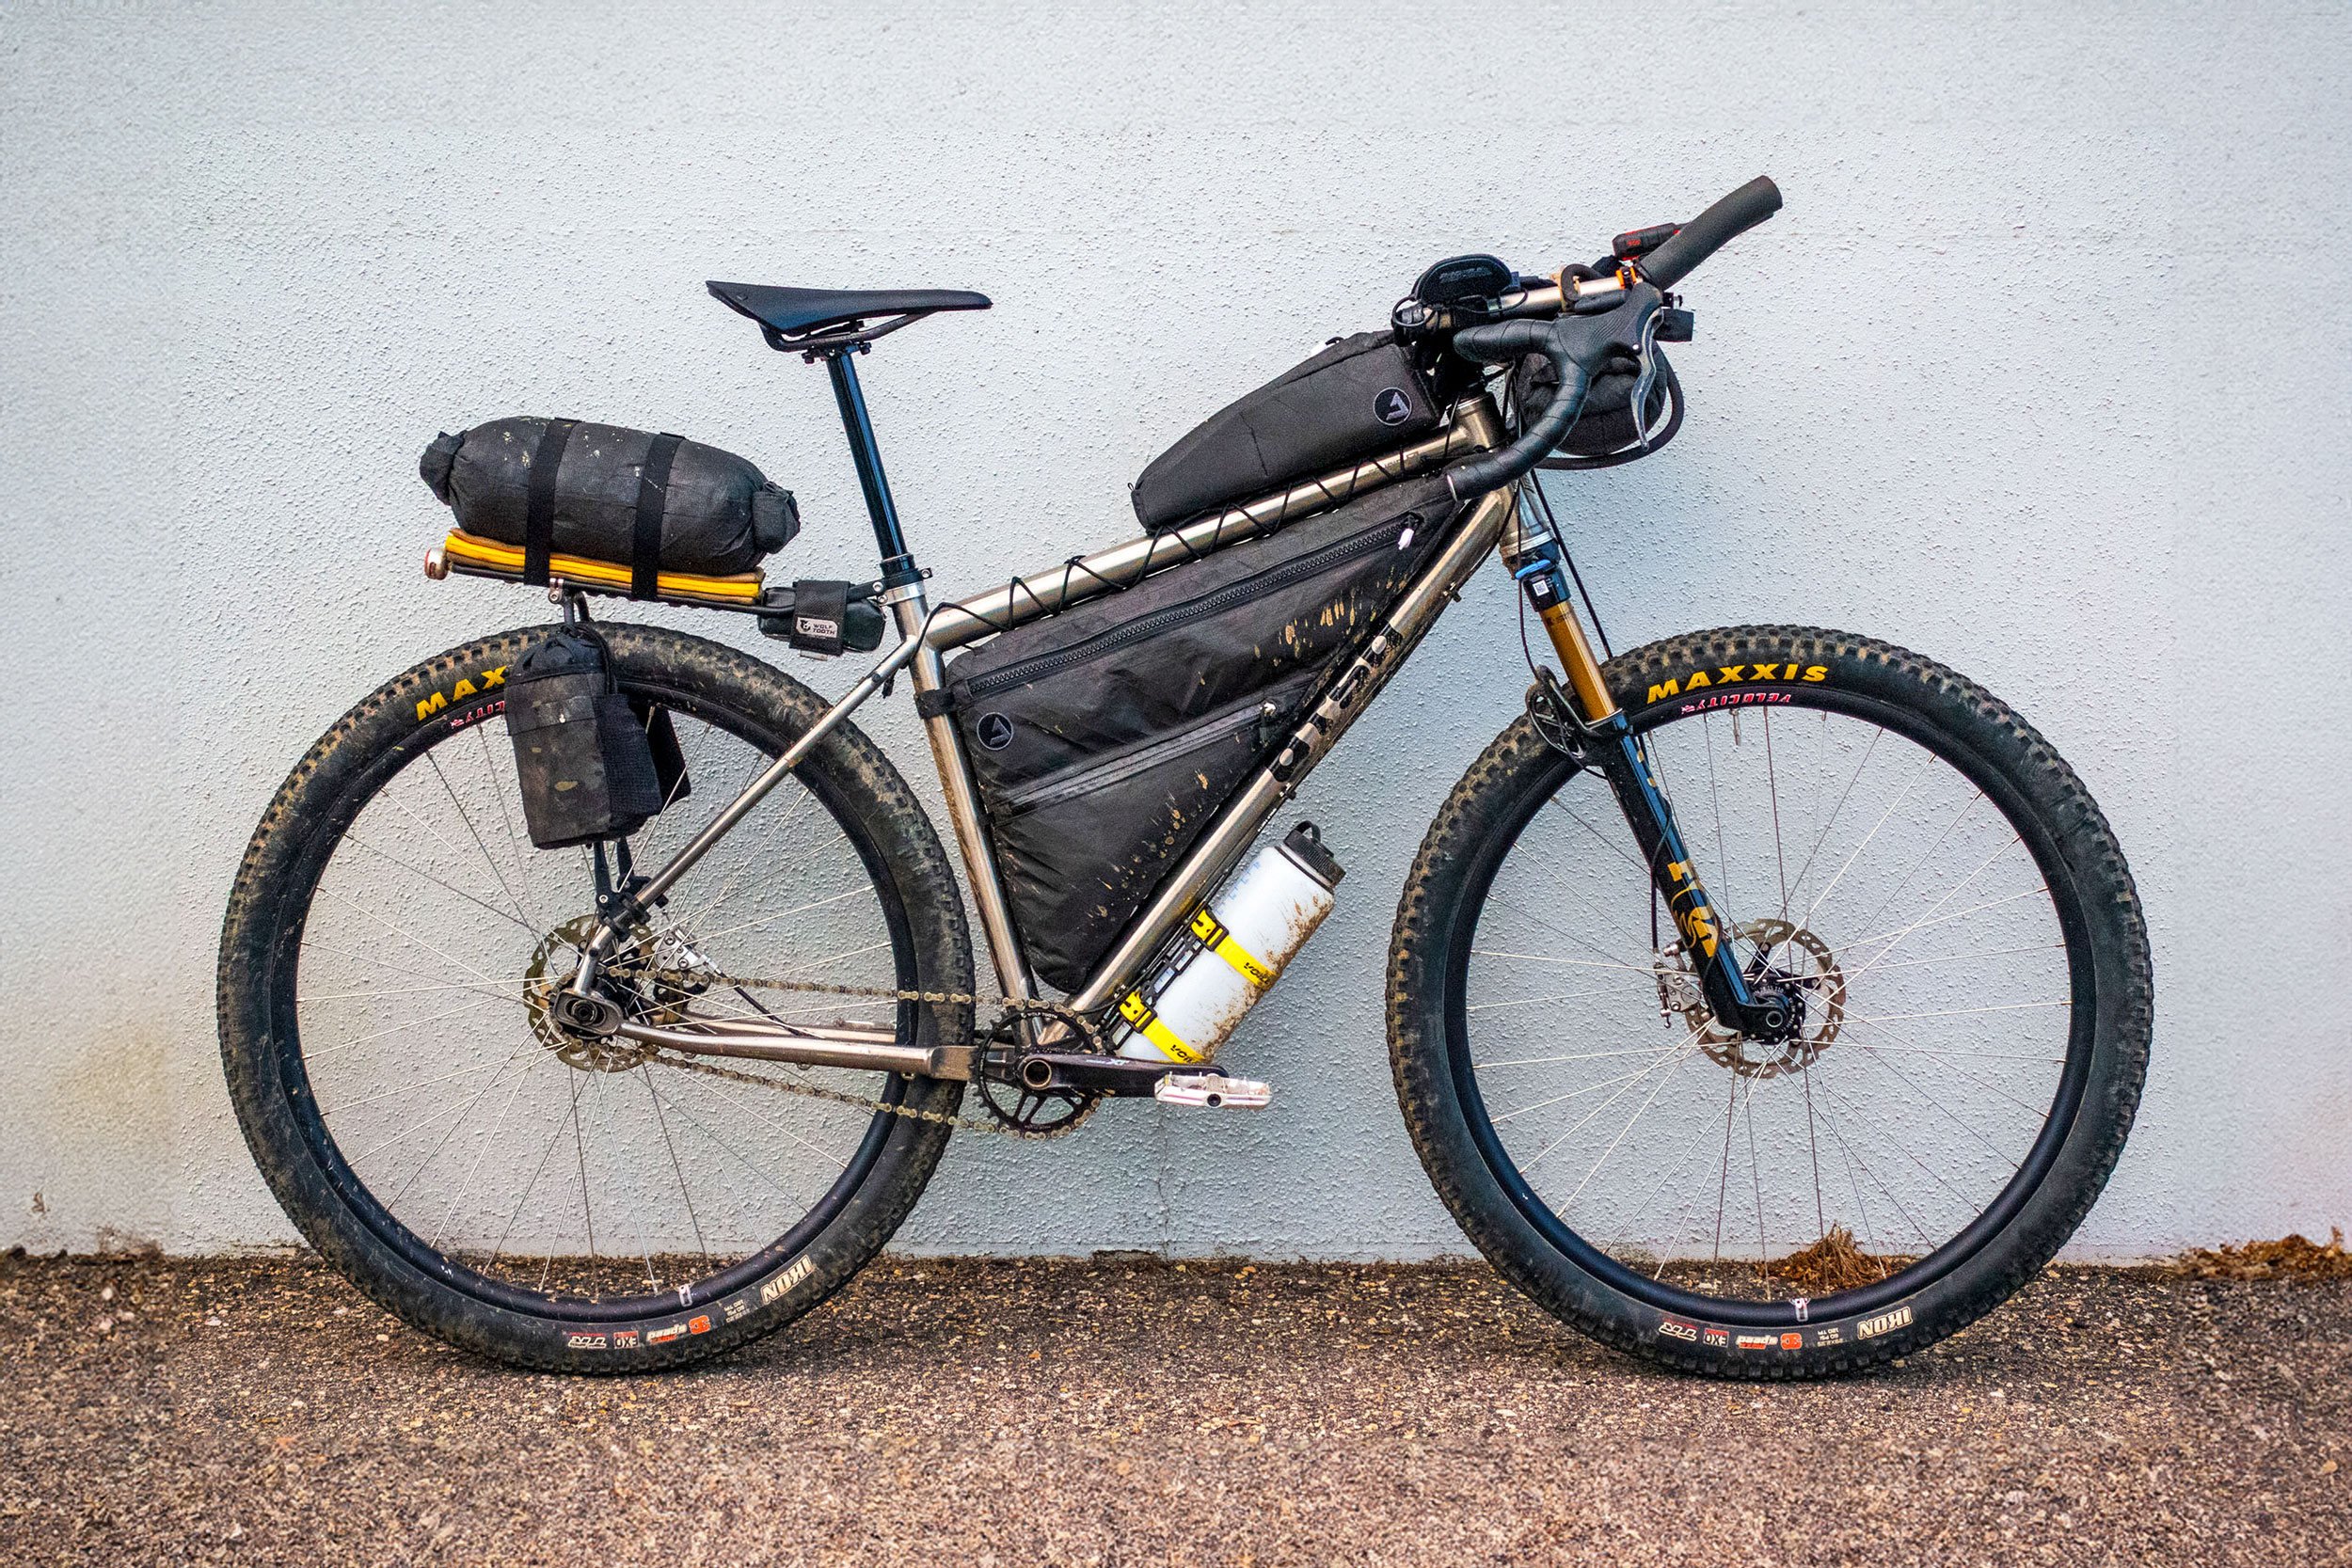
Like previous years, carbon bikes were by far the most popular. Sixty percent of the bikes were carbon, followed by 28 percent titanium, eight percent steel, and the rest aluminum. Carbon actually saw a bump compared to 2024. I’m not sure exactly why, but it’s a race, after all, and I noticed a lot of race-oriented bikes this year. Steel rigs, on the other hand, took a hit, dropping from 12 percent last year to just eight percent in 2025.


Of the 116 rigs, most folks were running aero bars. Only 15 opted out, while 101 went with them for the added hand positions and comfort. As for bike brands, Salsa takes the cake again, with 24 rigs, 20 of them being Cutthroats. No surprise there; it’s on par with last year’s numbers. Trek, Specialized, Otso, and Curve rounded out the top five. Outside of Cutthroats, other popular builds were five custom builds, four Fenrirs, and three each of Epics, Fargos, Supercalibers, and El Jefes.
Drivetrains and Gearing
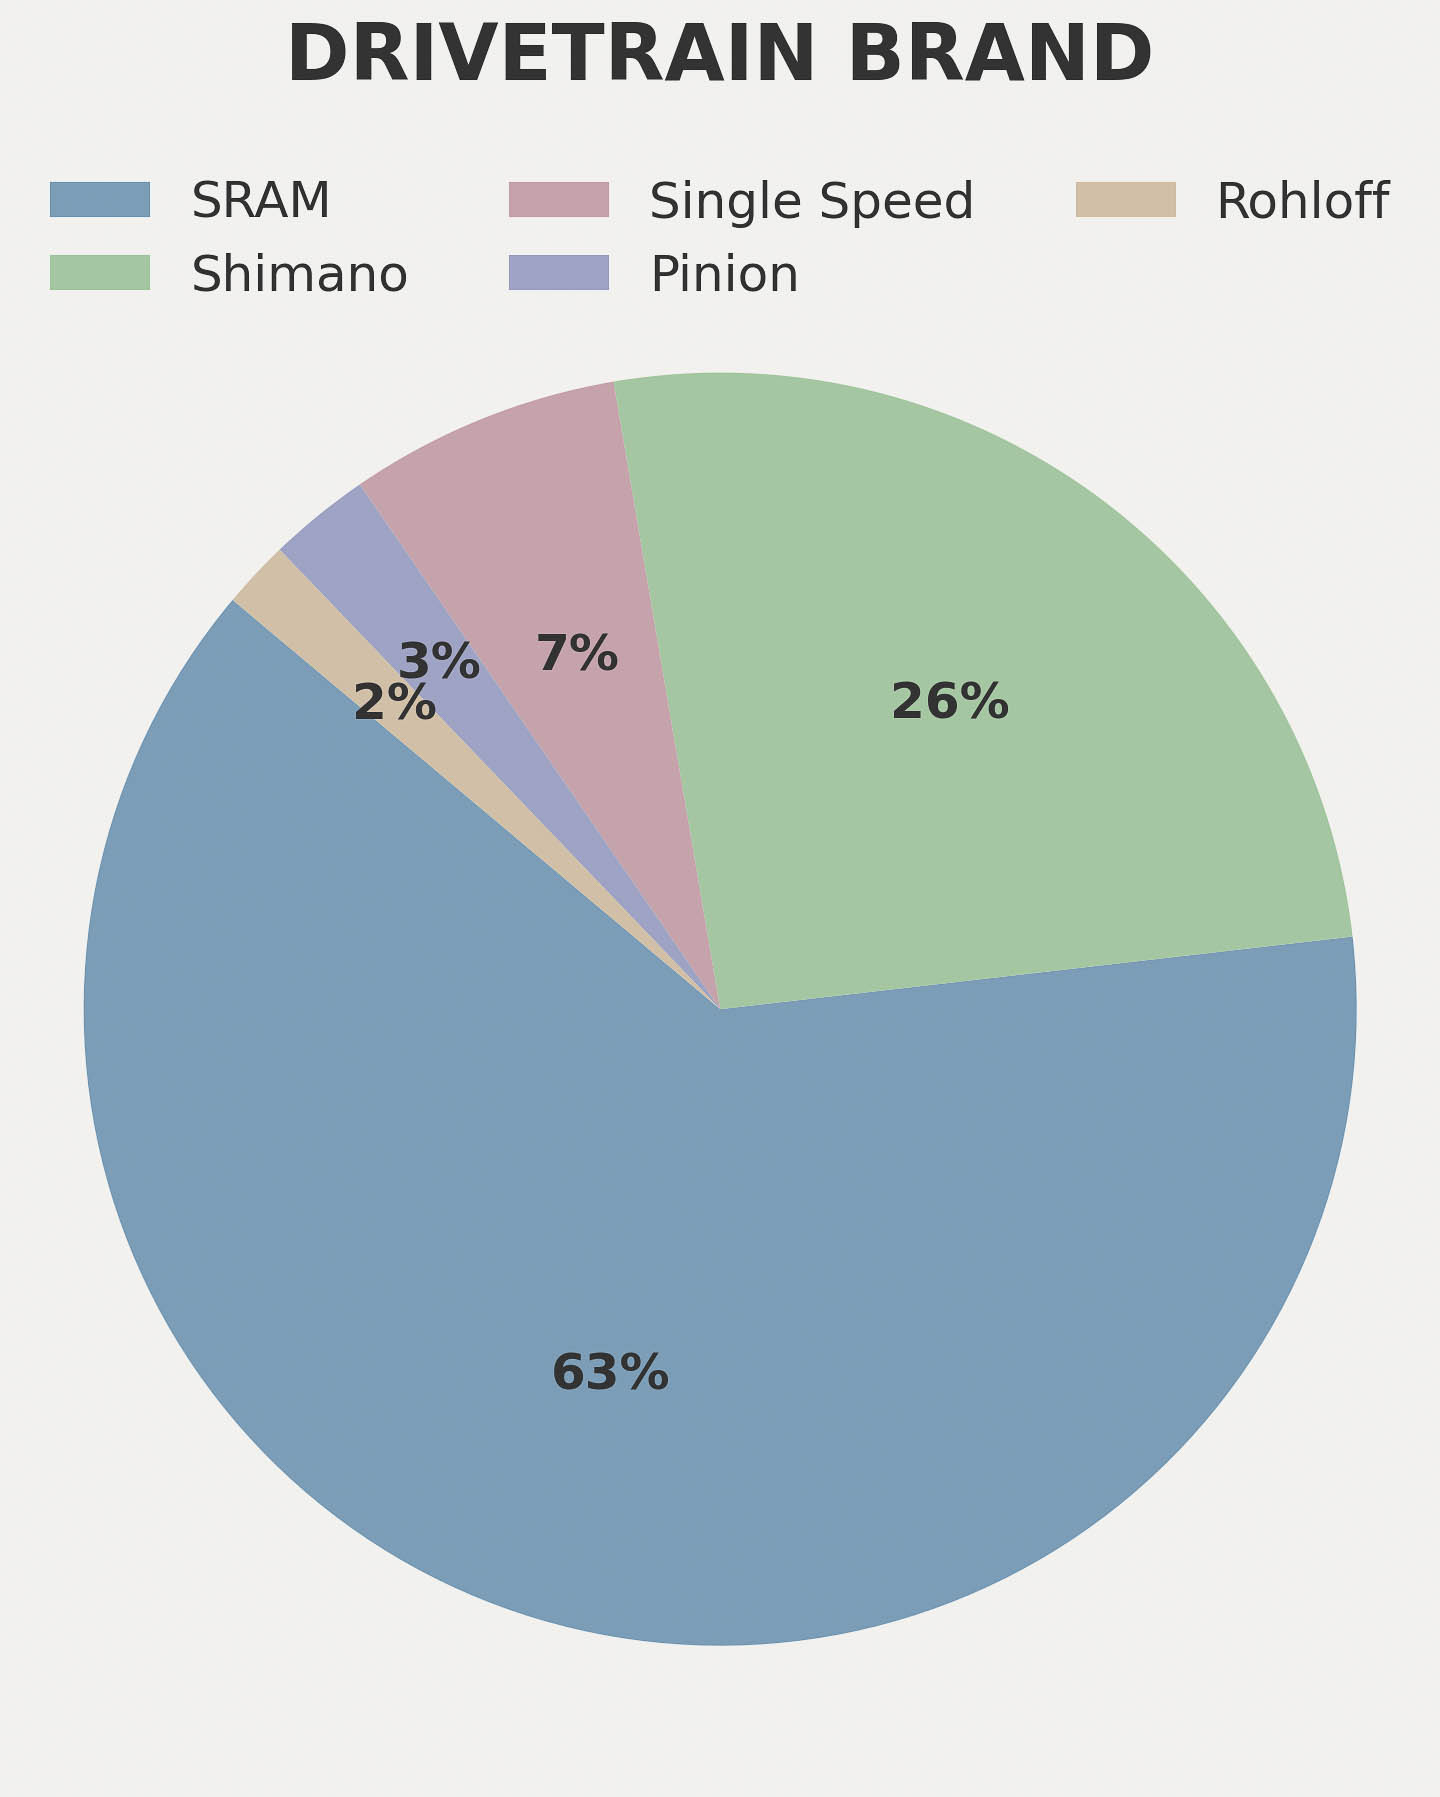
Not much changed from last year except for one particularly eye-opening stat. First and foremost, SRAM drivetrains continued to reign supreme, making up over 62 percent of the bikes, with Shimano accounting for just under 26 percent. That’s a slight year-over-year increase for SRAM. There were also a handful of Pinion-equipped bikes again this year, plus a couple of folks running 14-speed Rohloff hubs. And let’s not forget the eight brave singlespeeders, making up nearly seven percent of the 116 rigs I counted.
The biggest shift I noticed this year is the growing acceptance of electronic drivetrains. For whatever reason, folks seem to be getting more comfortable with them. A total of 49 percent of riders were using electronic shifting, compared to 51 percent running mechanical. In 2024, only 31 percent of racers were rocking electronic systems. All but one of those were SRAM setups, the lone exception being one new XTR Di2 wireless system I reviewed a couple of weeks ago. Of the 57 electronic systems, over 38 percent were SRAM direct-mount Transmission builds. I’d guess electronic shifting will take the lead next year, especially with Shimano in the mix with their new wireless XTR, XT, and Deore groups.
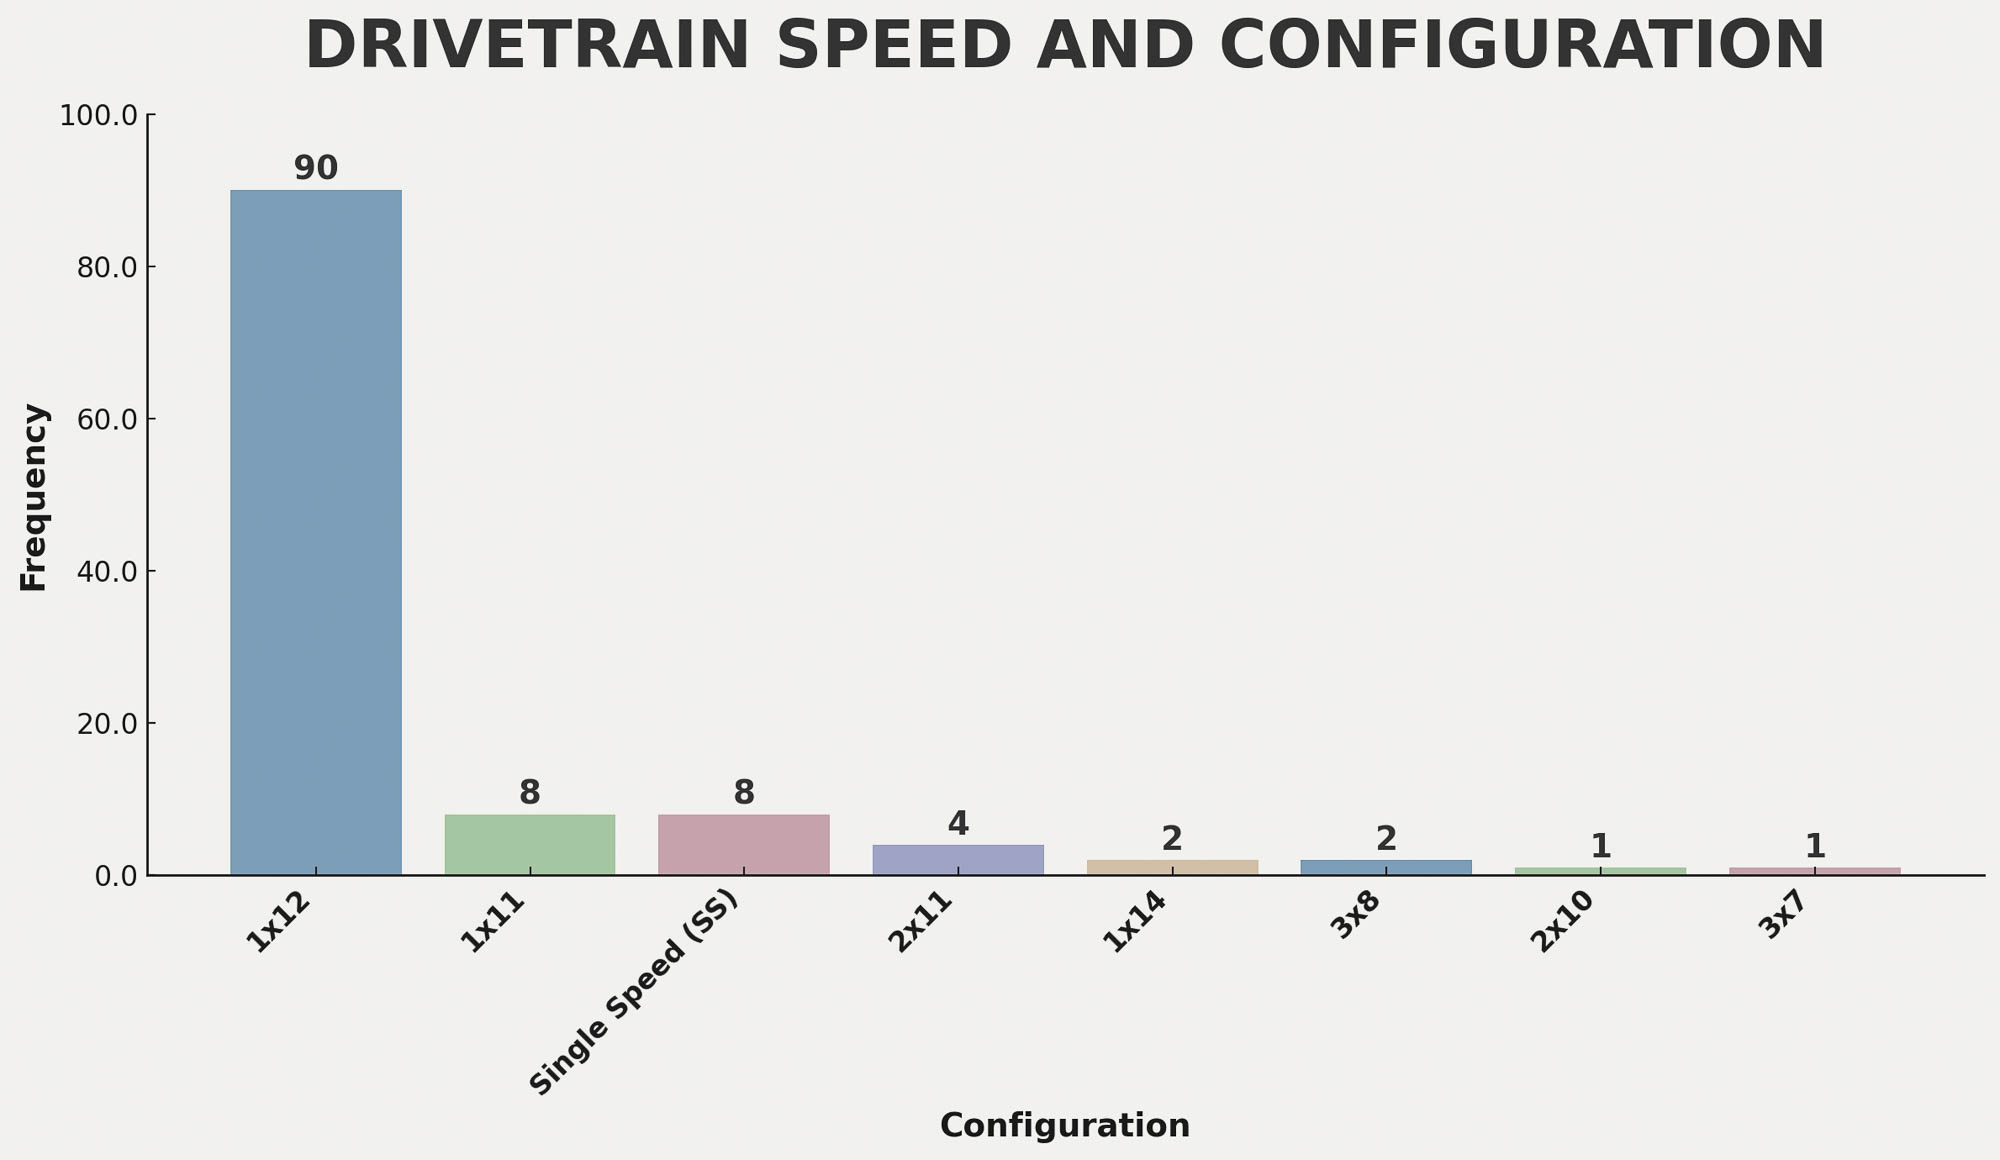
Zooming in on gearing, there were 107 1x setups, 90 of which were 12-speed—no surprise there, as that’s been the standard for a while now. A few of those were 12-speed Pinion gearboxes. Beyond that, there were eight 1x11s, eight singlespeeders, four 2x11s, two Rohloffs (1×14), two 3x8s, one 2×10, and one 3×7.

As for chainring size, 34-tooth rings were once again the most popular, showing up on 32 rigs. That was followed closely by 32-tooth rings. After that, we saw 30-tooth rings on 11 bikes, 36-tooth rings on nine, four 40-tooth and 38-tooth rings, and three 28-tooth rings.
And diving into singlespeed ratios, of the eight riders, two were on 32×18, two on 34×18, two on 32×17, one ran 32×16, and one was spinning a 39×24. I love seeing the one-speed crowd out there. There’s something about the simplicity and lack of maintenance beyond the occasional chain tension. Just clean, direct power. Hats off to those folks.
Tires
Ahh, the classic chatter about tires and what to run. It’s an age-old debate but an important one. You want something durable enough to make it the full 2,700 miles but with enough tread to handle a variety of terrain. Most racers start with a brand-new set of tires—that’s what I did—and even then, they’re usually trashed by the end.
As for wheel size, no surprise here: 29ers continue to dominate. Nearly 94 percent of riders are running 29″ wheels, just under five percent are on 27.5, and only two folks are rolling 26″ wheels.
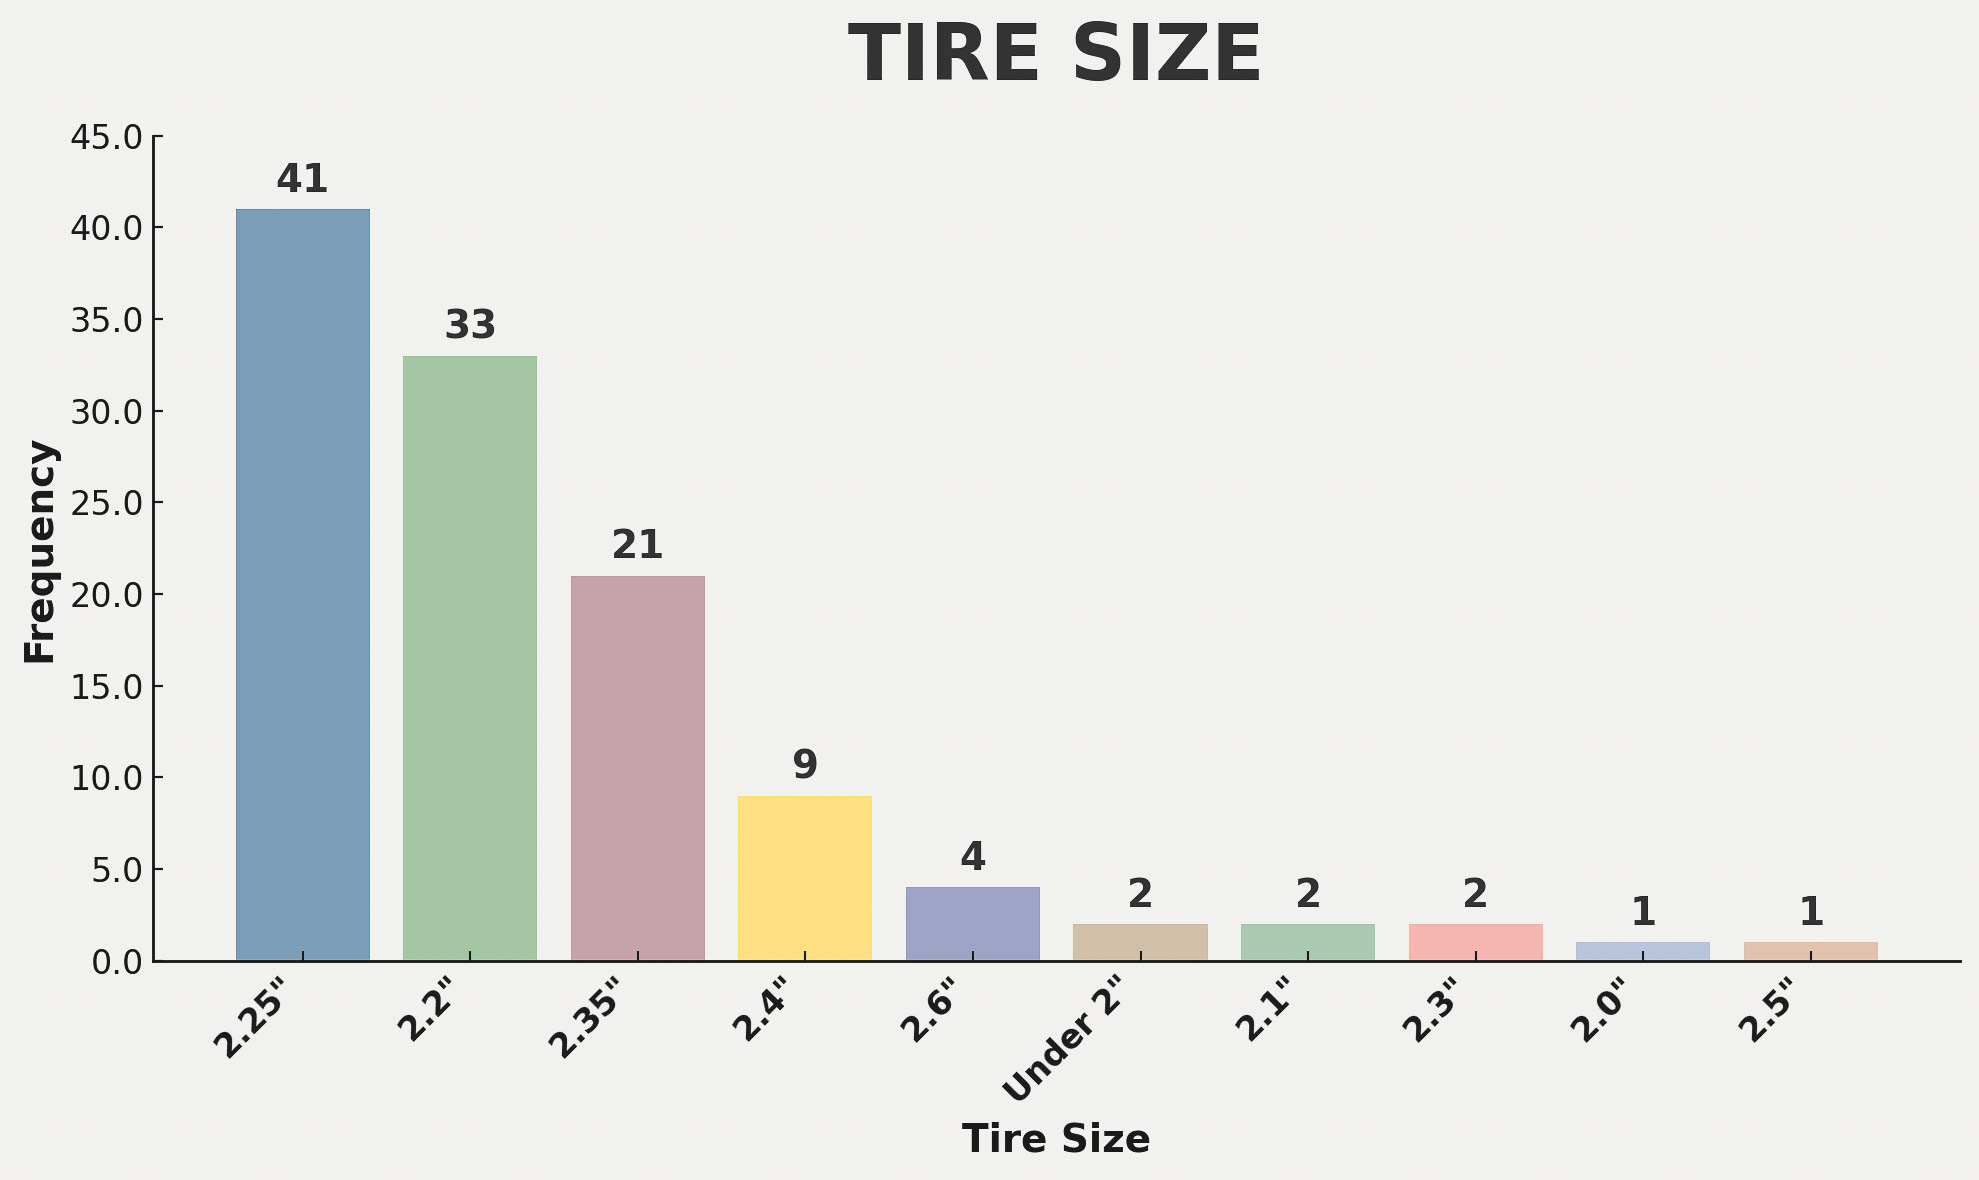
In previous years, I grouped tire sizes together, but this time, I wanted to break it down by width because it tells a better story. The most popular size was 2.25″ with 41 riders using them, followed by 2.2″ with 33. In third was 2.35″ with 21 riders. From there, it drops off pretty sharply as things get either skinnier or wider. It’s worth noting that only a couple of folks ran under 2″ tires, a 48mm and 45mm. Such tires don’t usually fare well on the Divide, but that often comes down to bike clearance, which I’ll touch on more when we get into veteran setups.
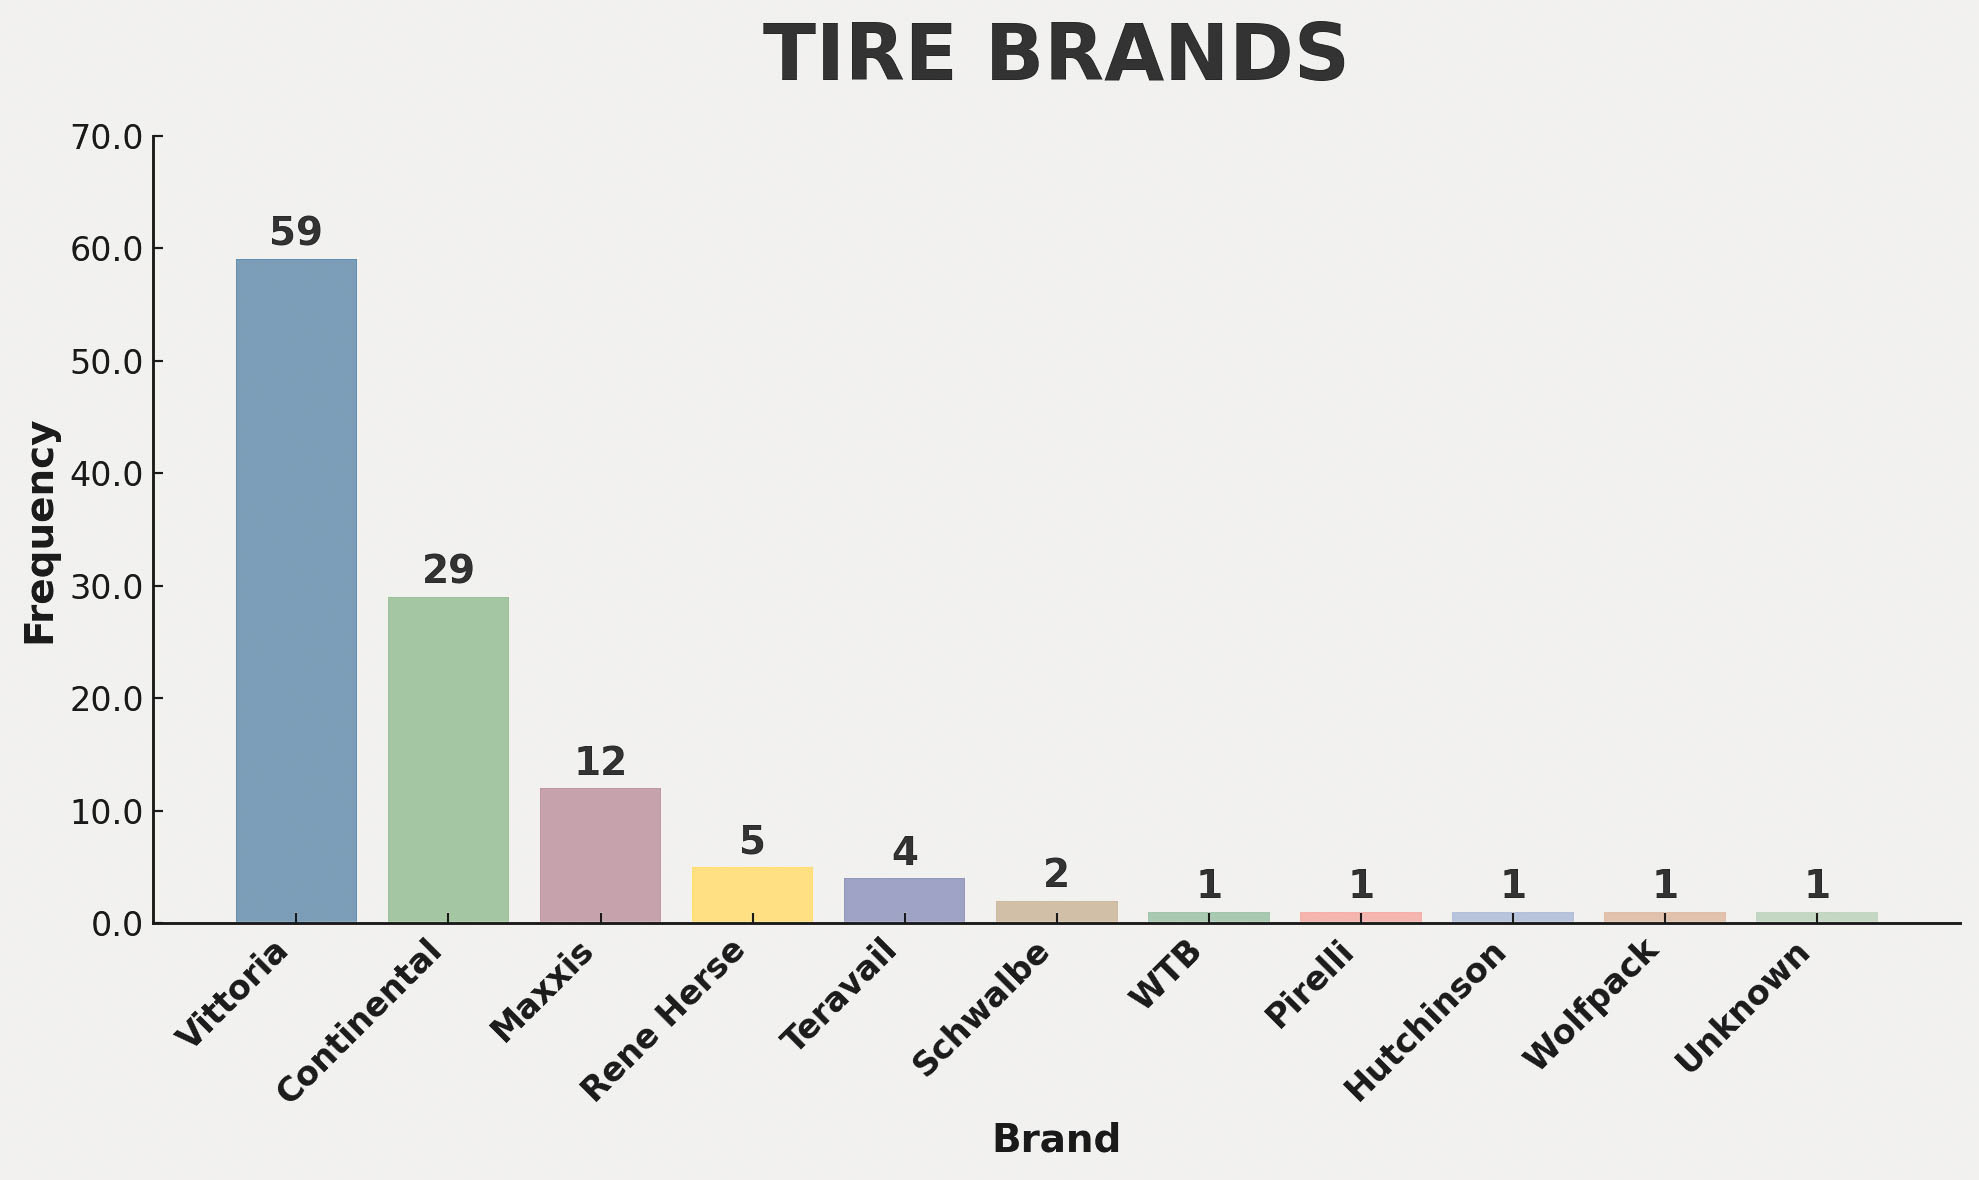
Looking at brands, Vittoria once again leads the pack with 59 riders choosing their tires. But the biggest surprise was Continental. They saw a big jump this year with 29 riders on their rubber. Maxxis and Rene Herse followed behind, with a spread of others after that.
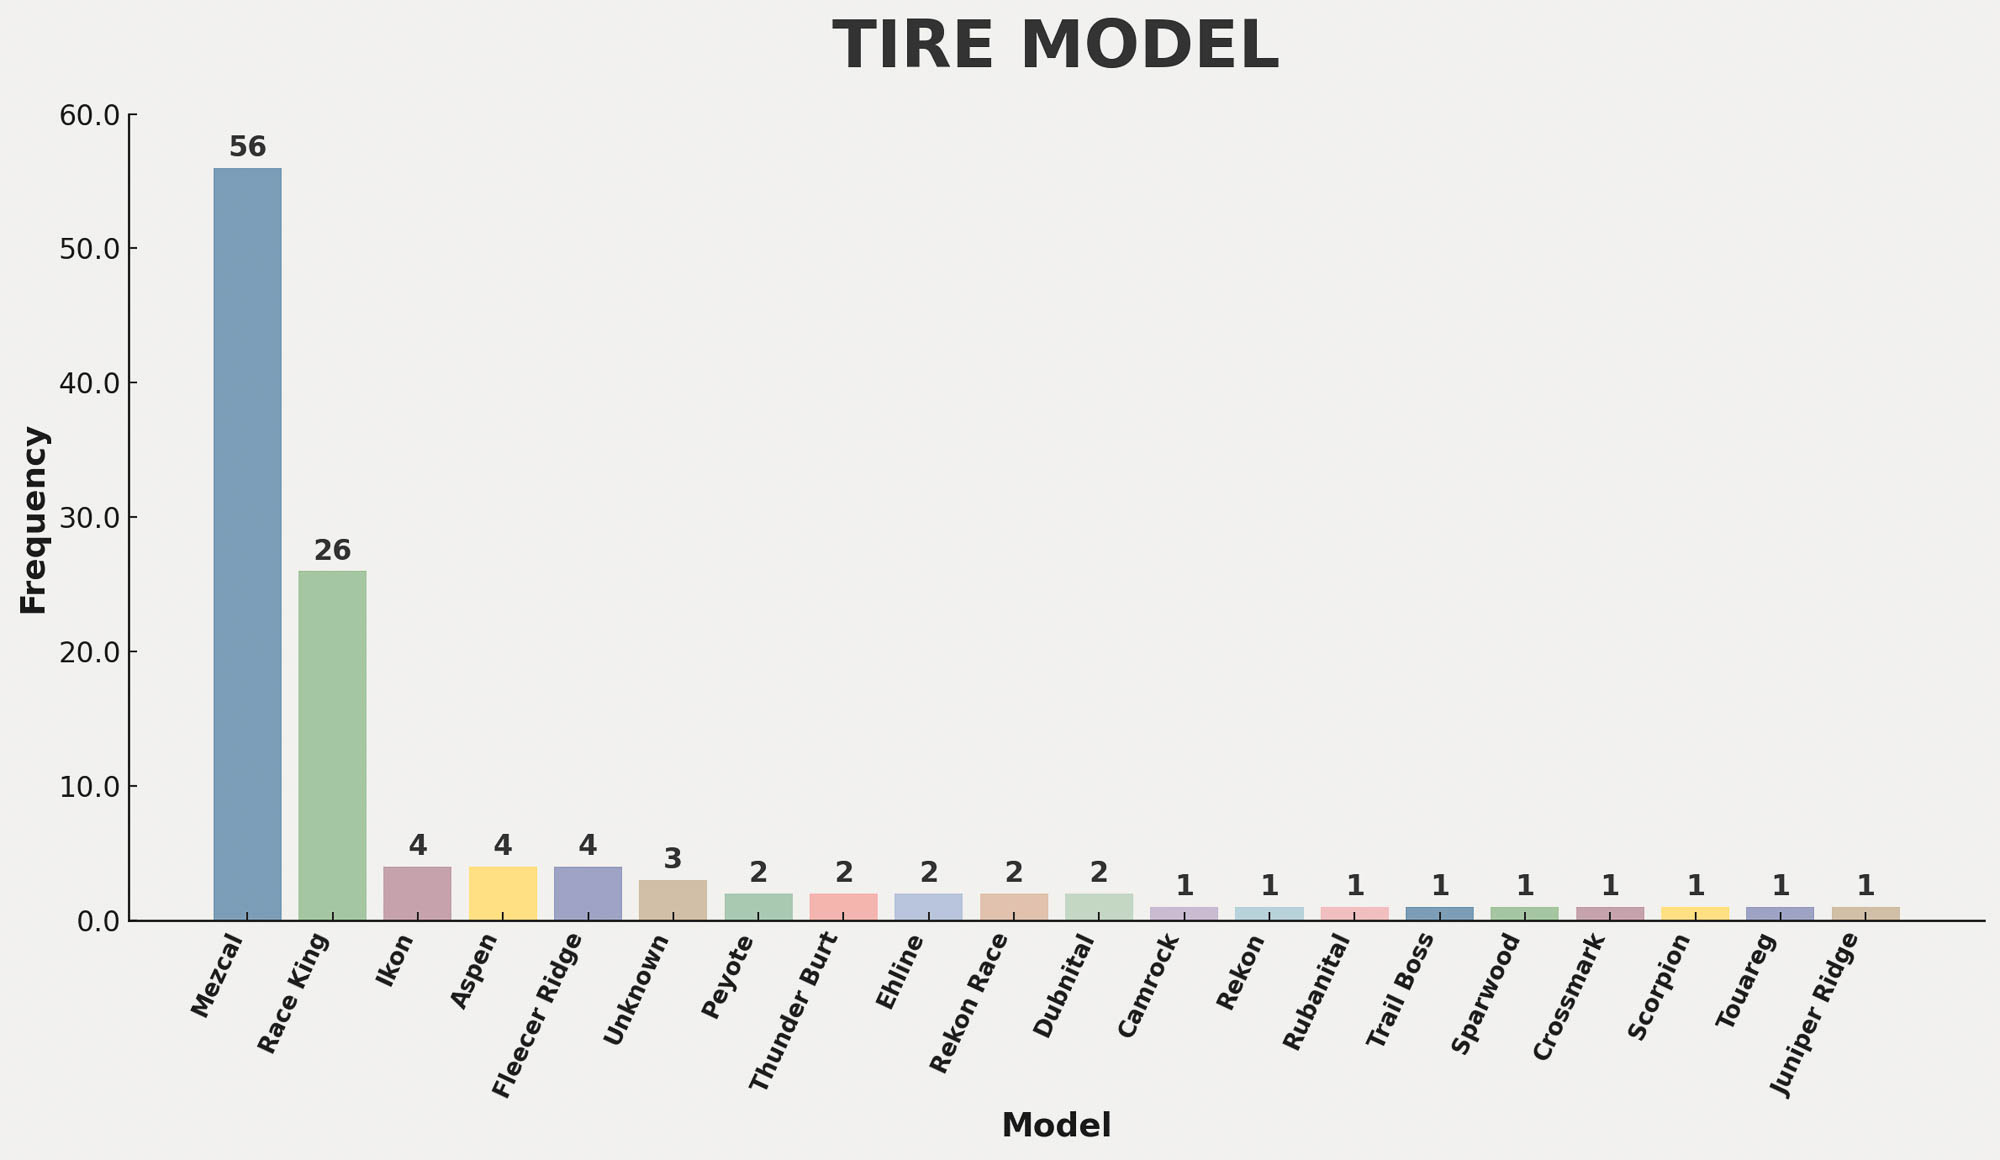
Of the 59 Vittoria users, 56 were running the Mezcal, which continues to be a go-to for its fast-rolling tread. As for Continental, their growth was thanks to the soon-to-be-defunct Race King, which is set to be replaced by the Dubnital. I’m not certain why they saw a big increase; maybe they were on sale? Regardless, after the Race King, a mix of Maxxis tires and the Fleecer Ridge round out the top choices, followed by various others.


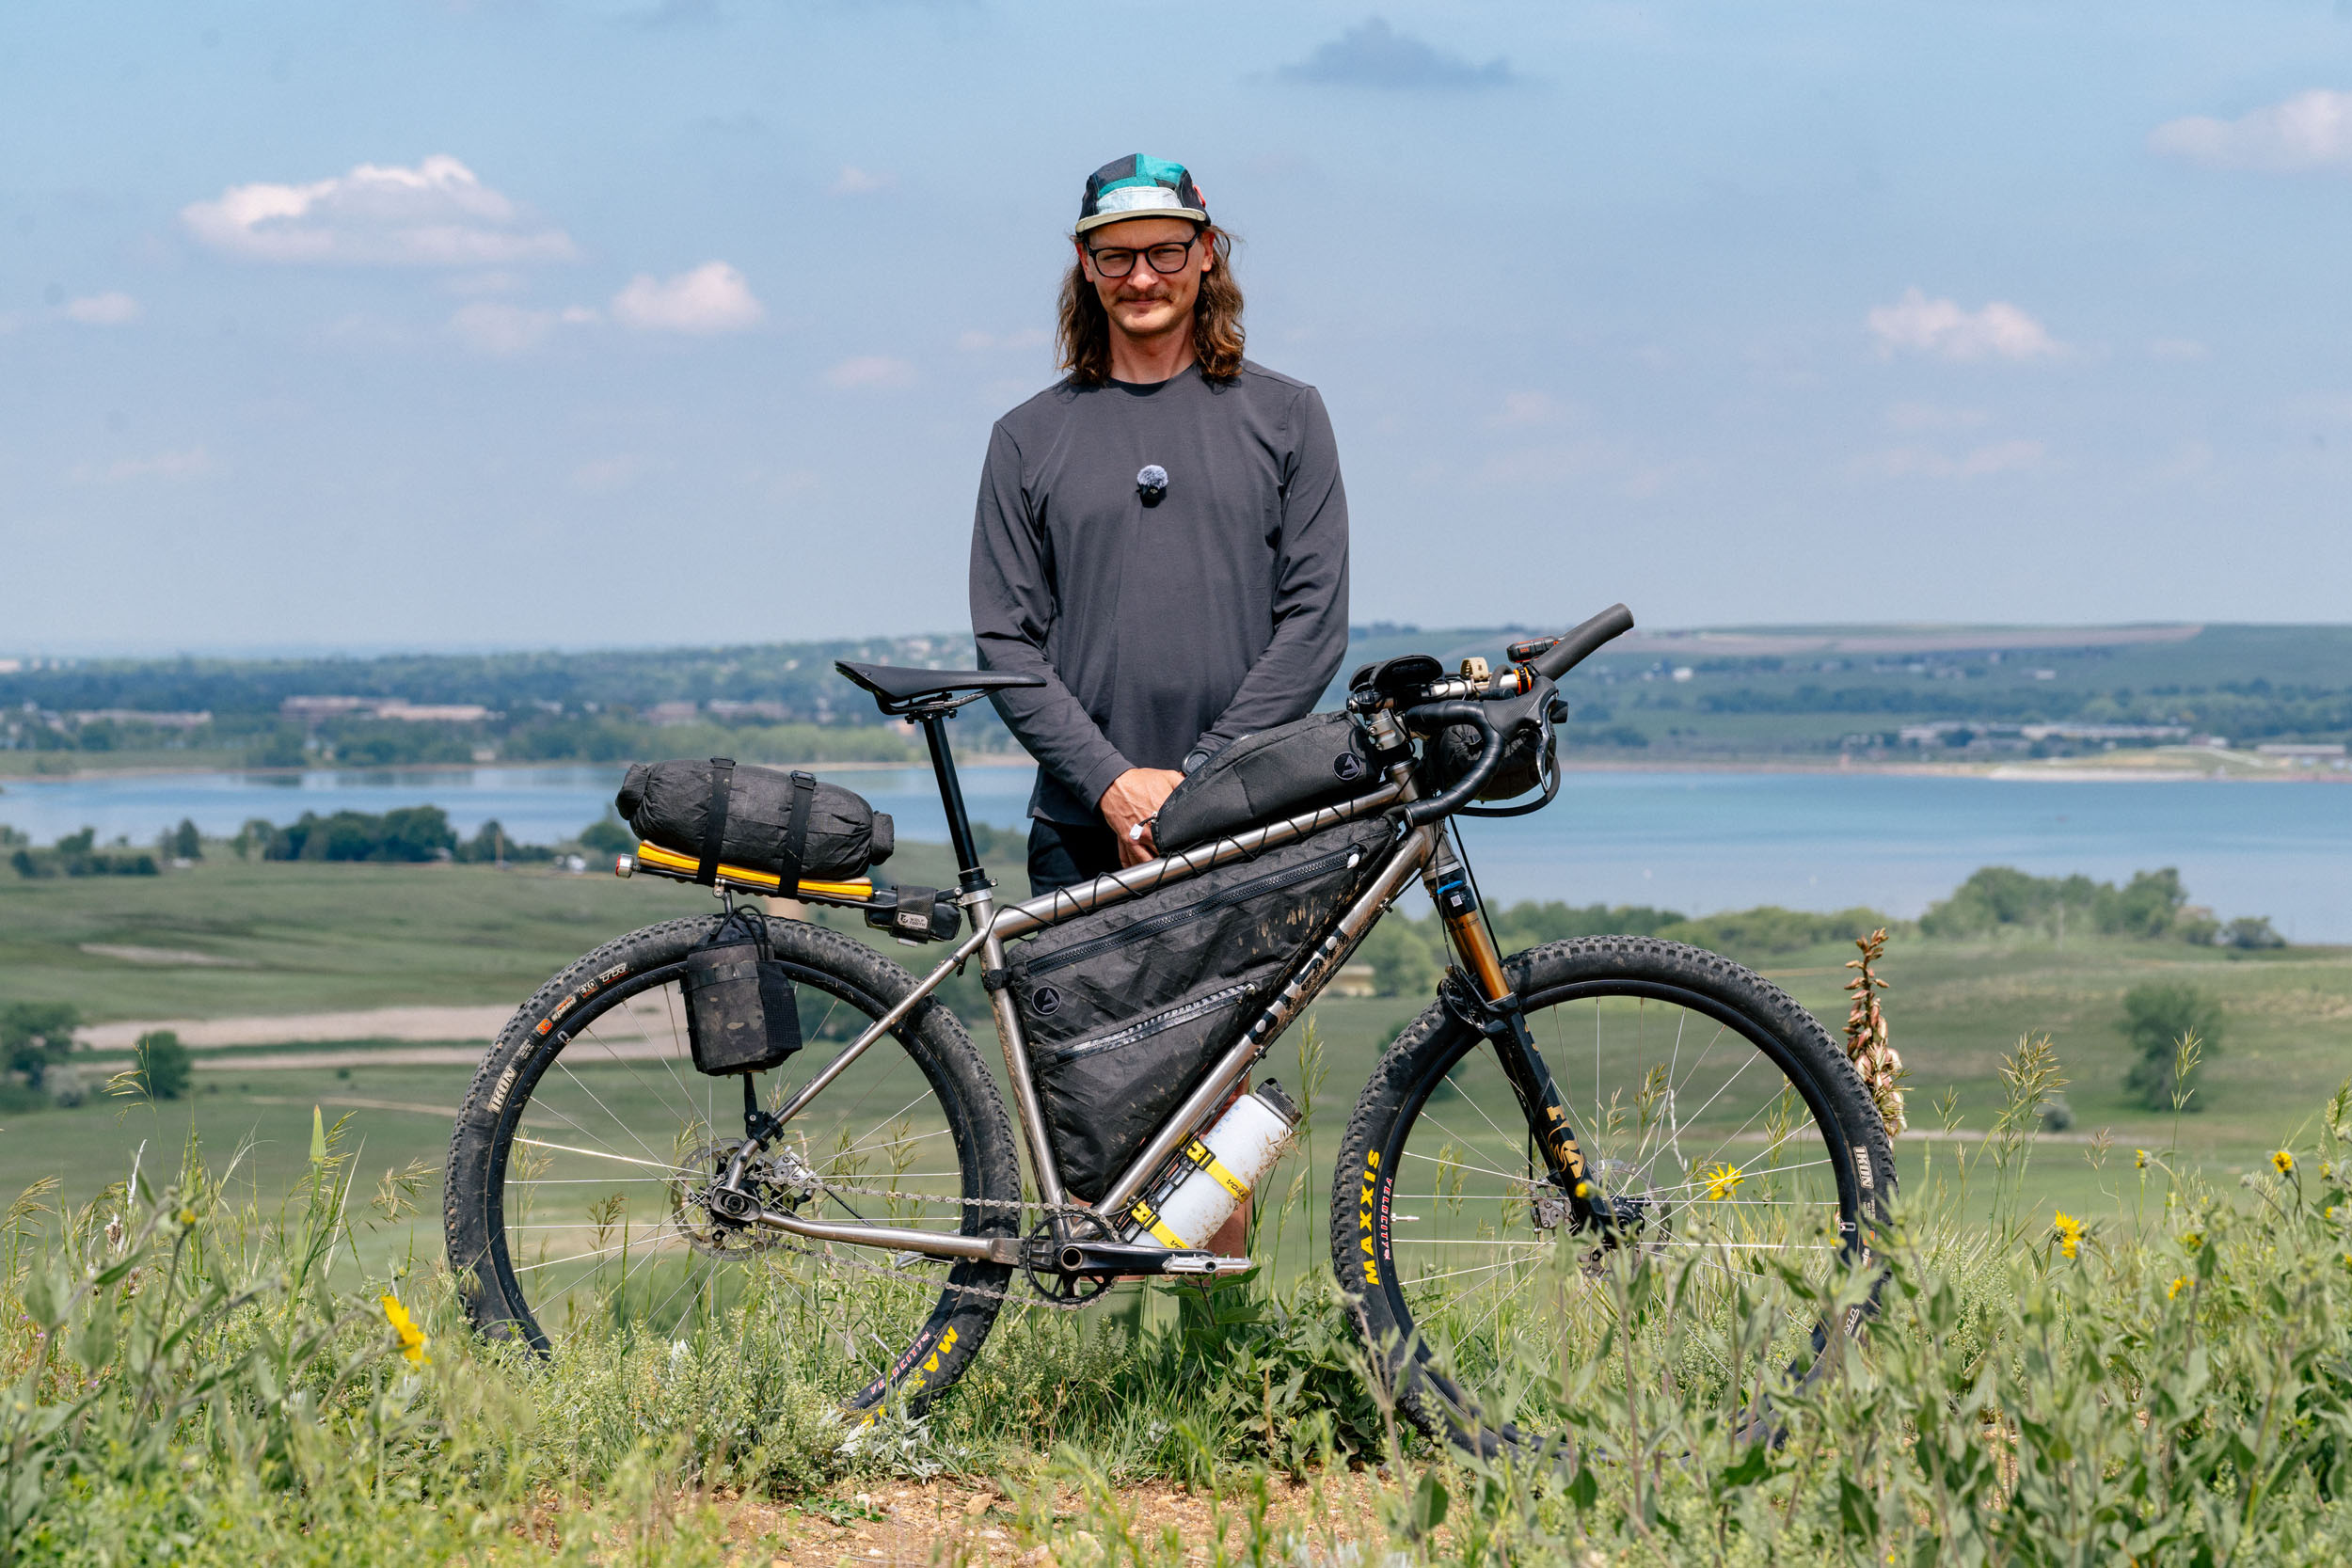
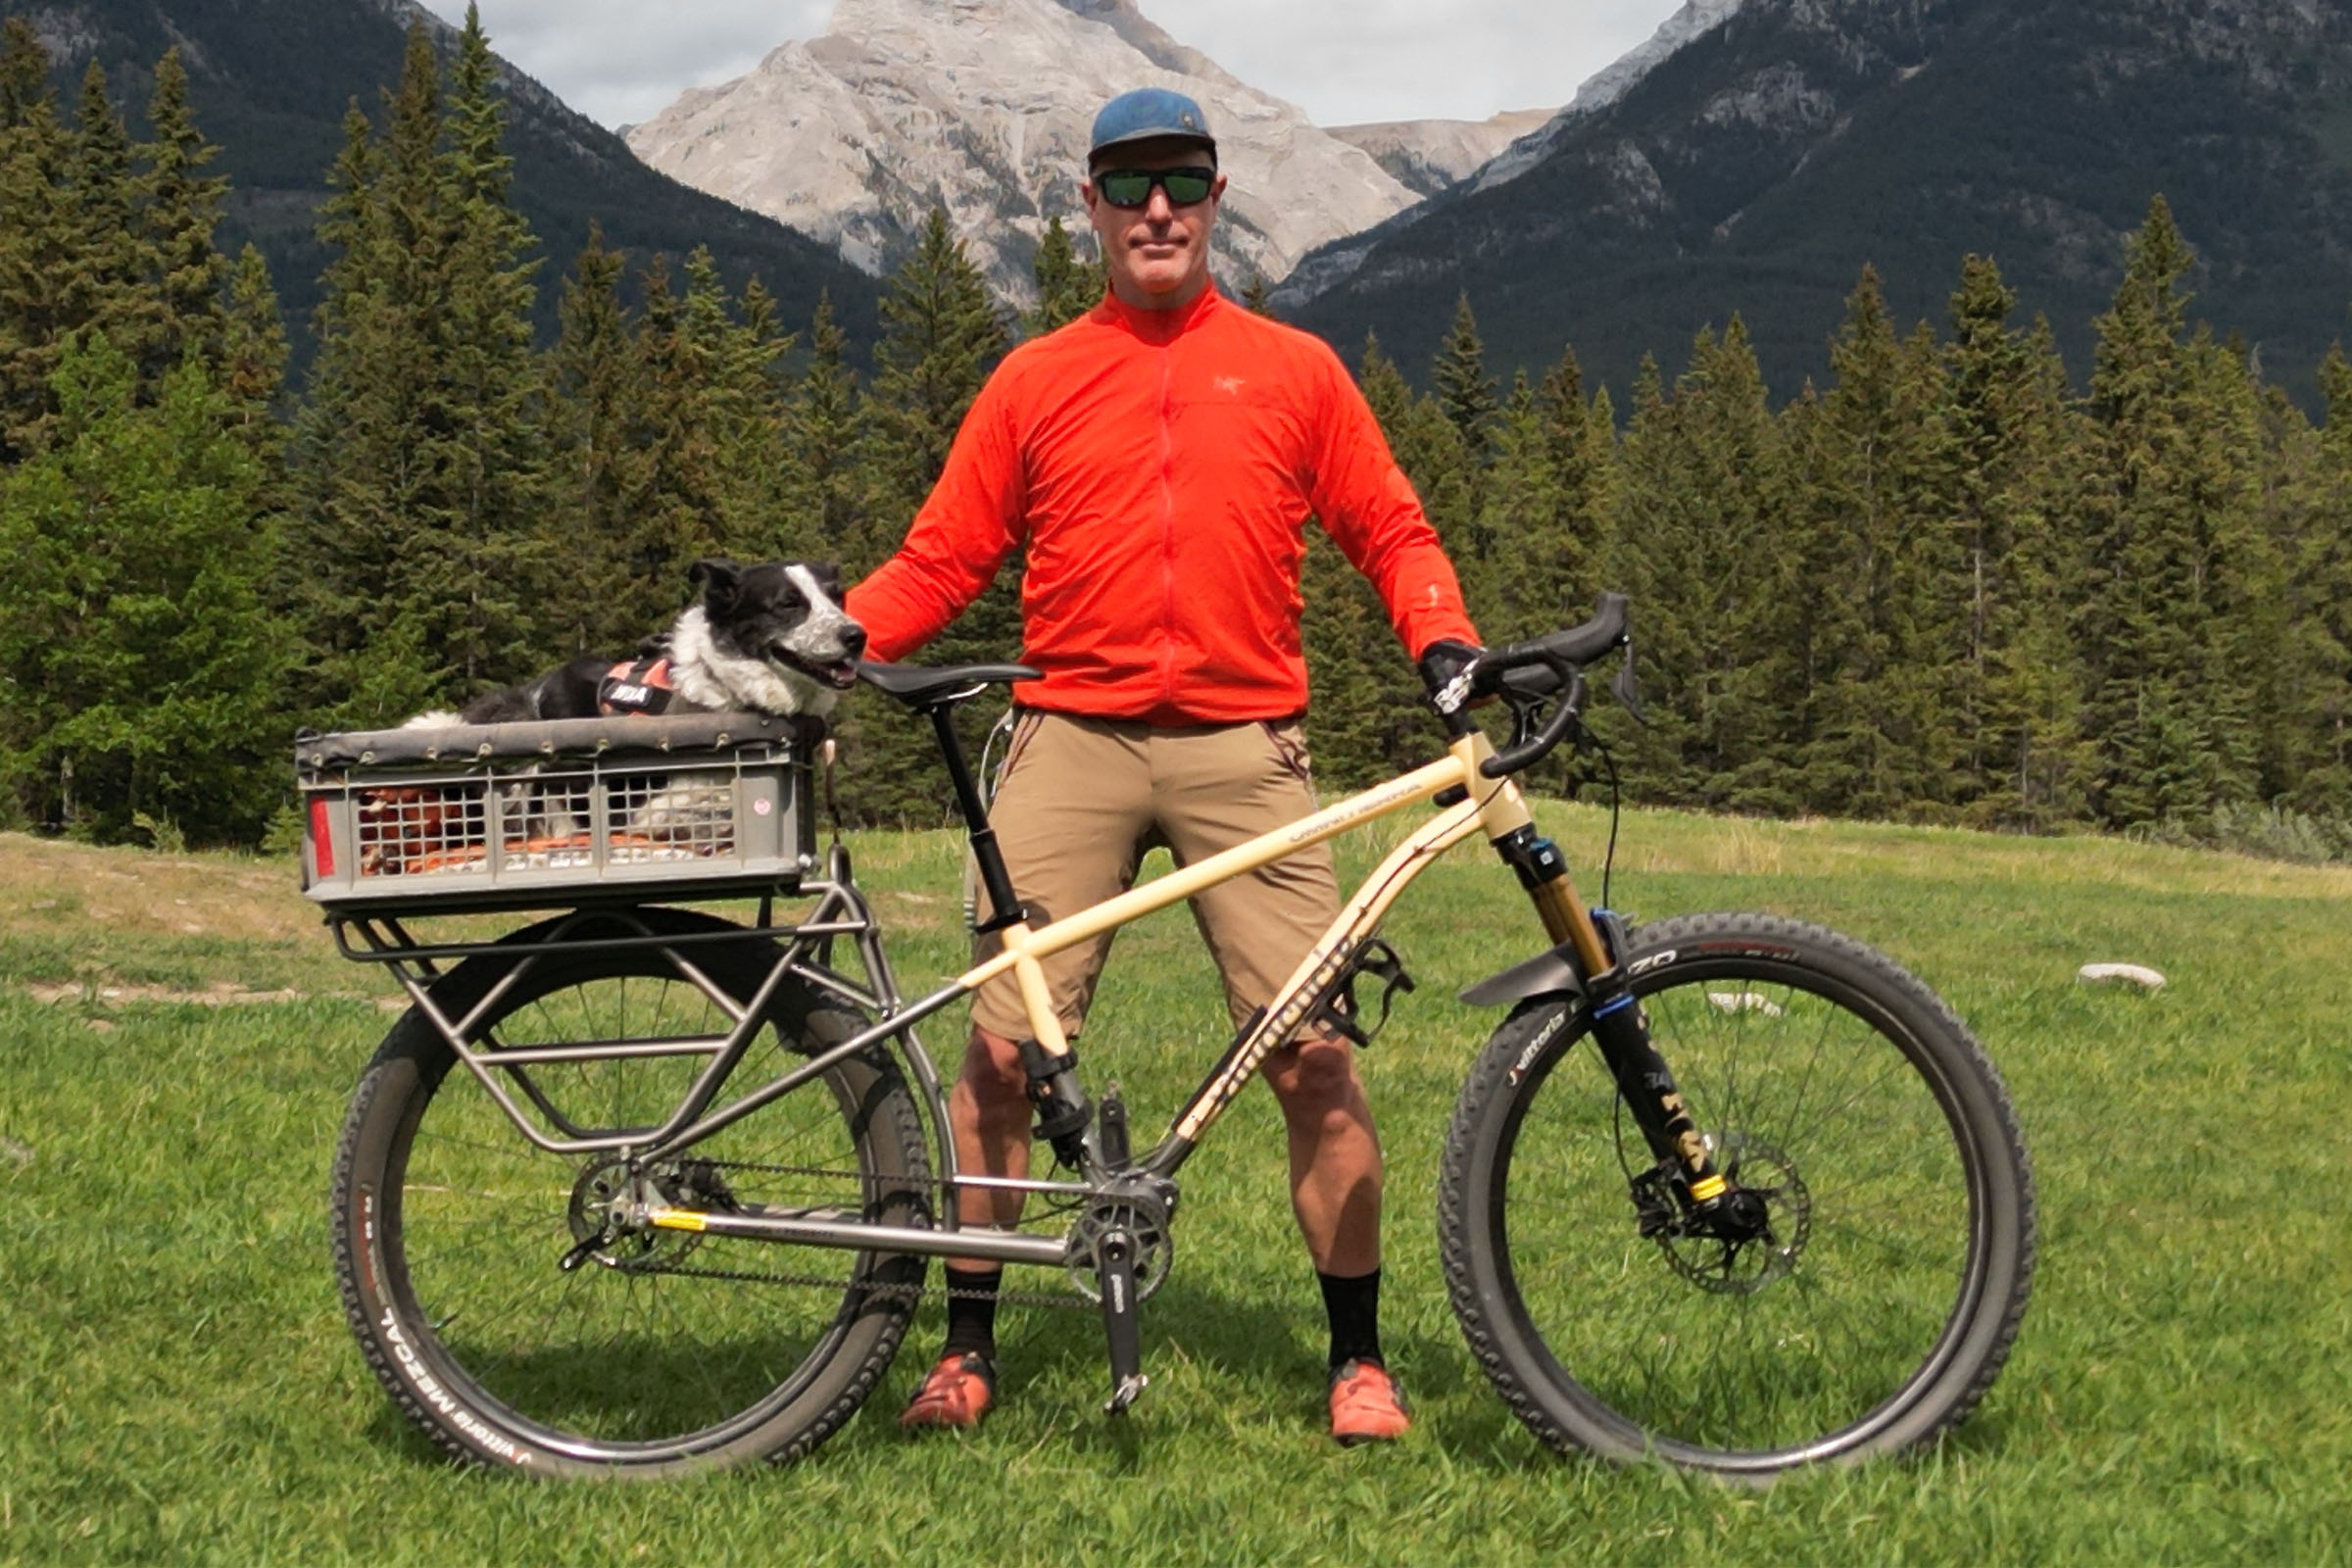
Cargo
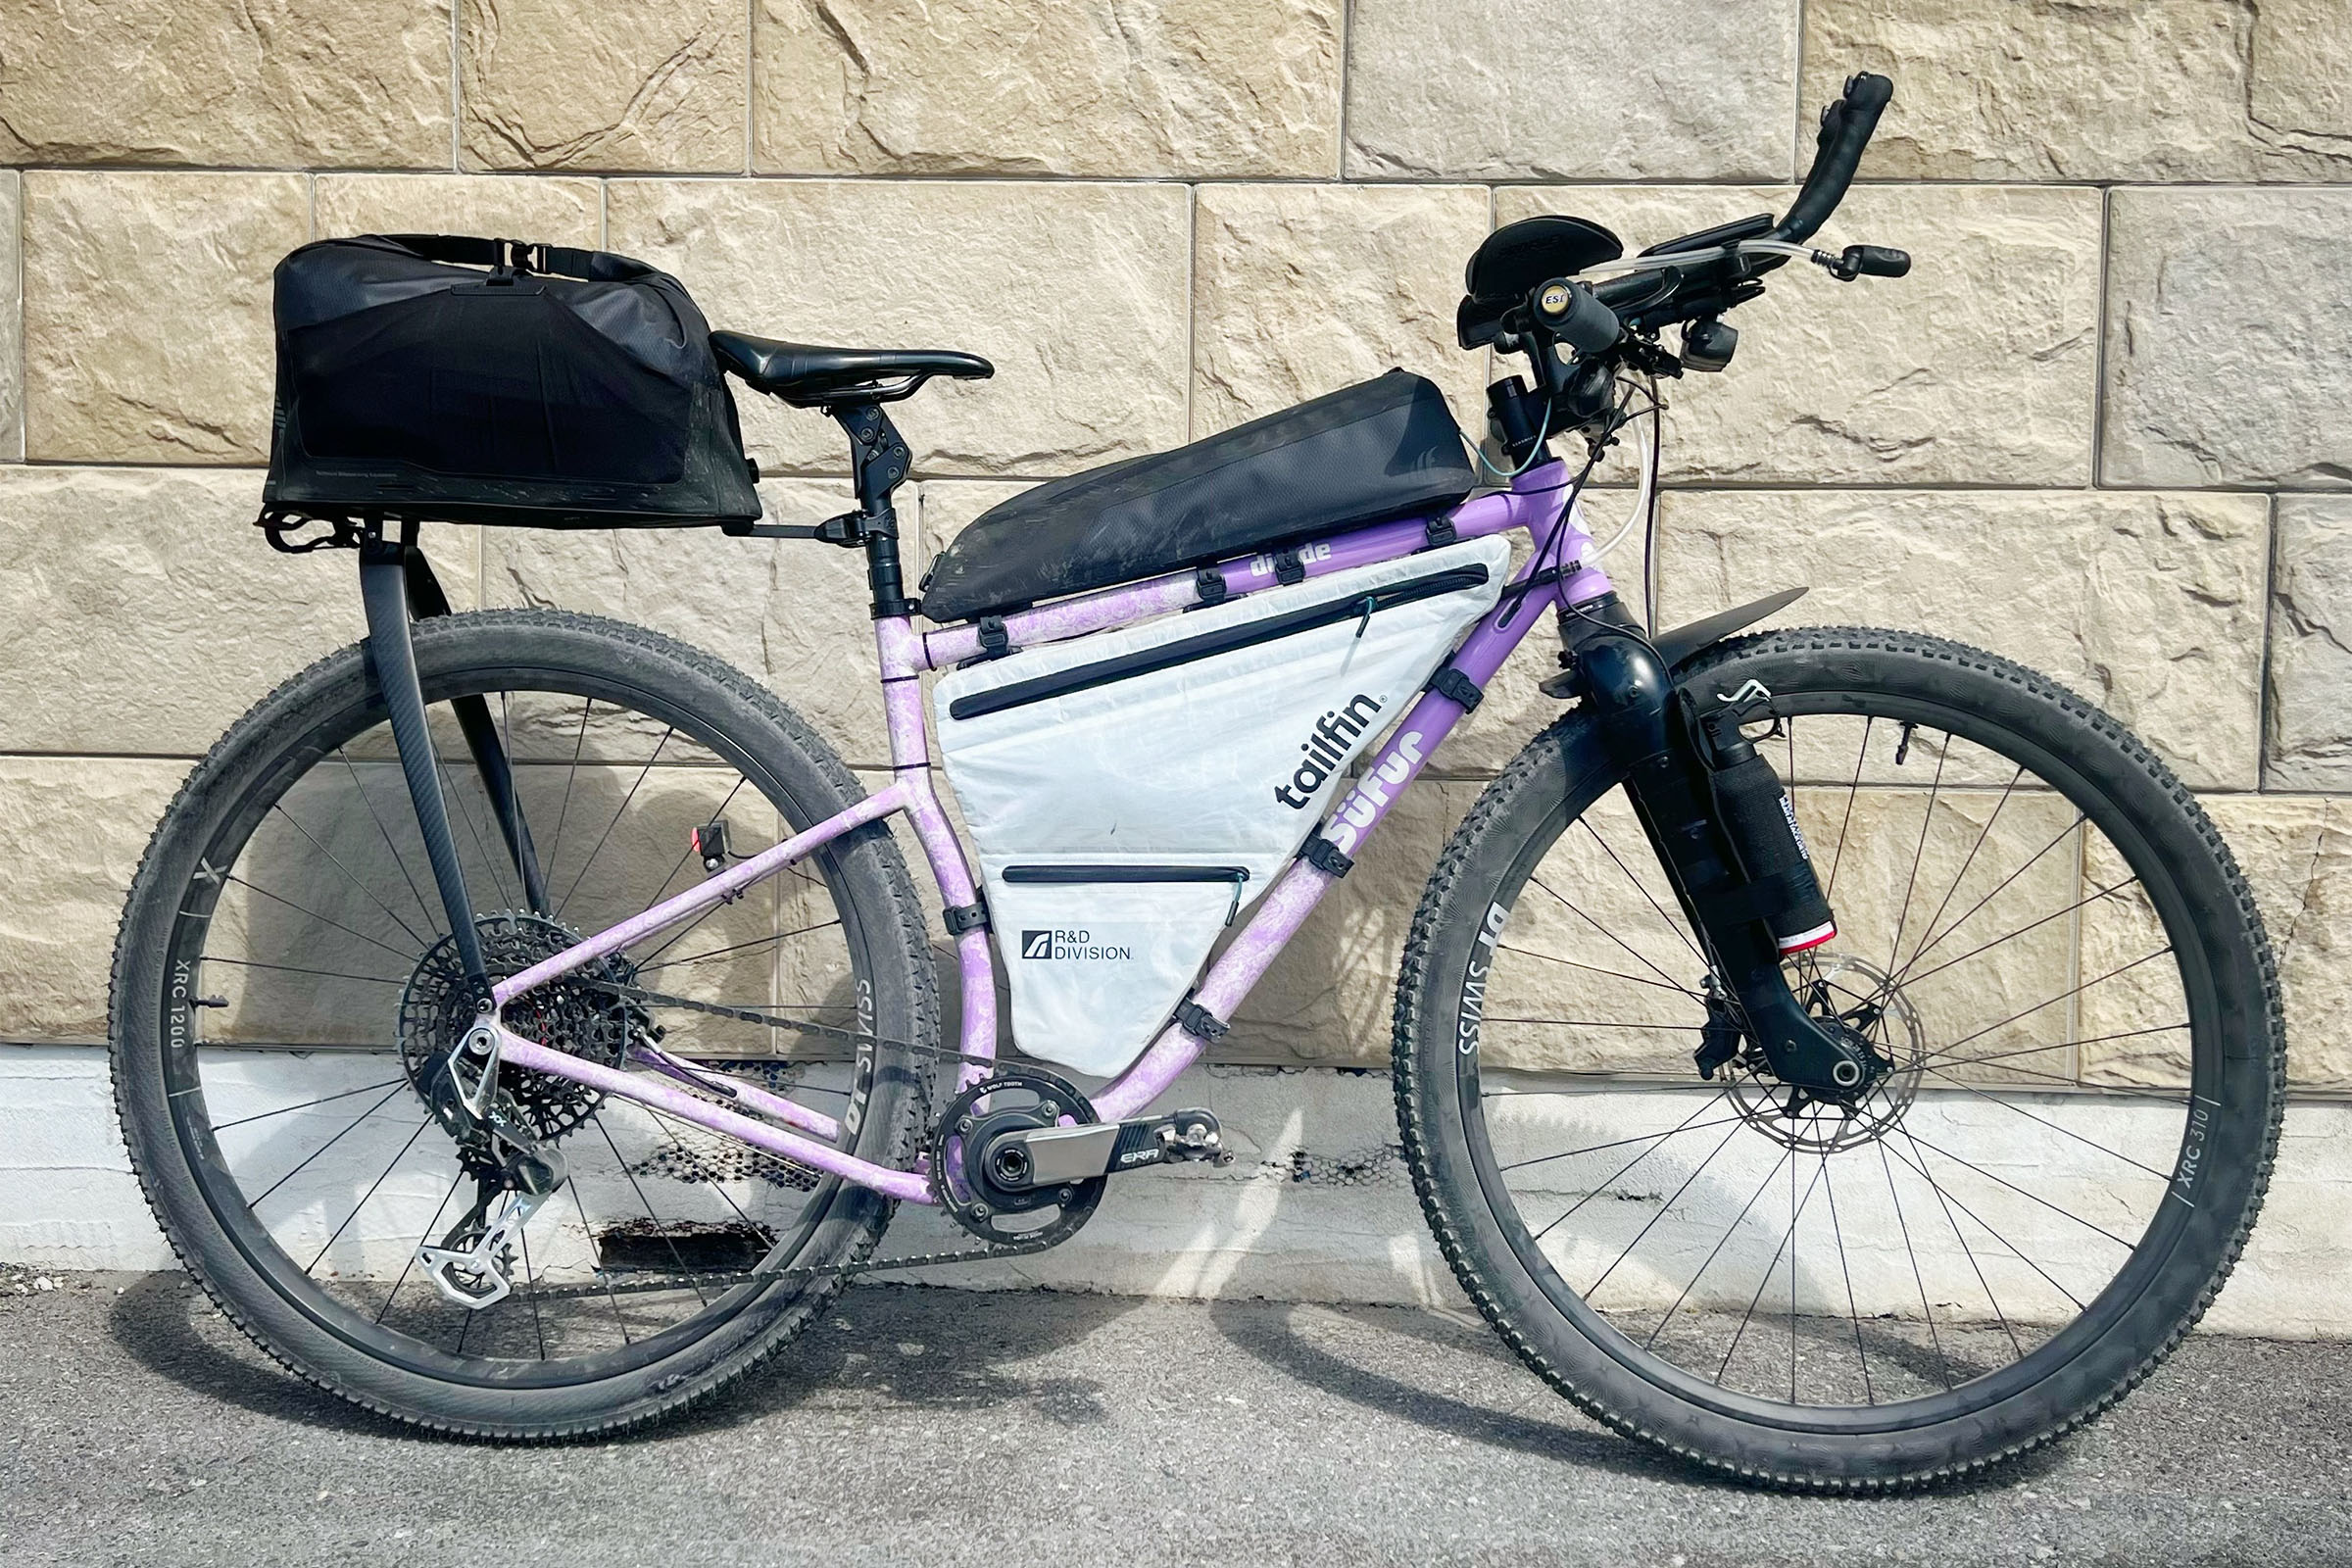
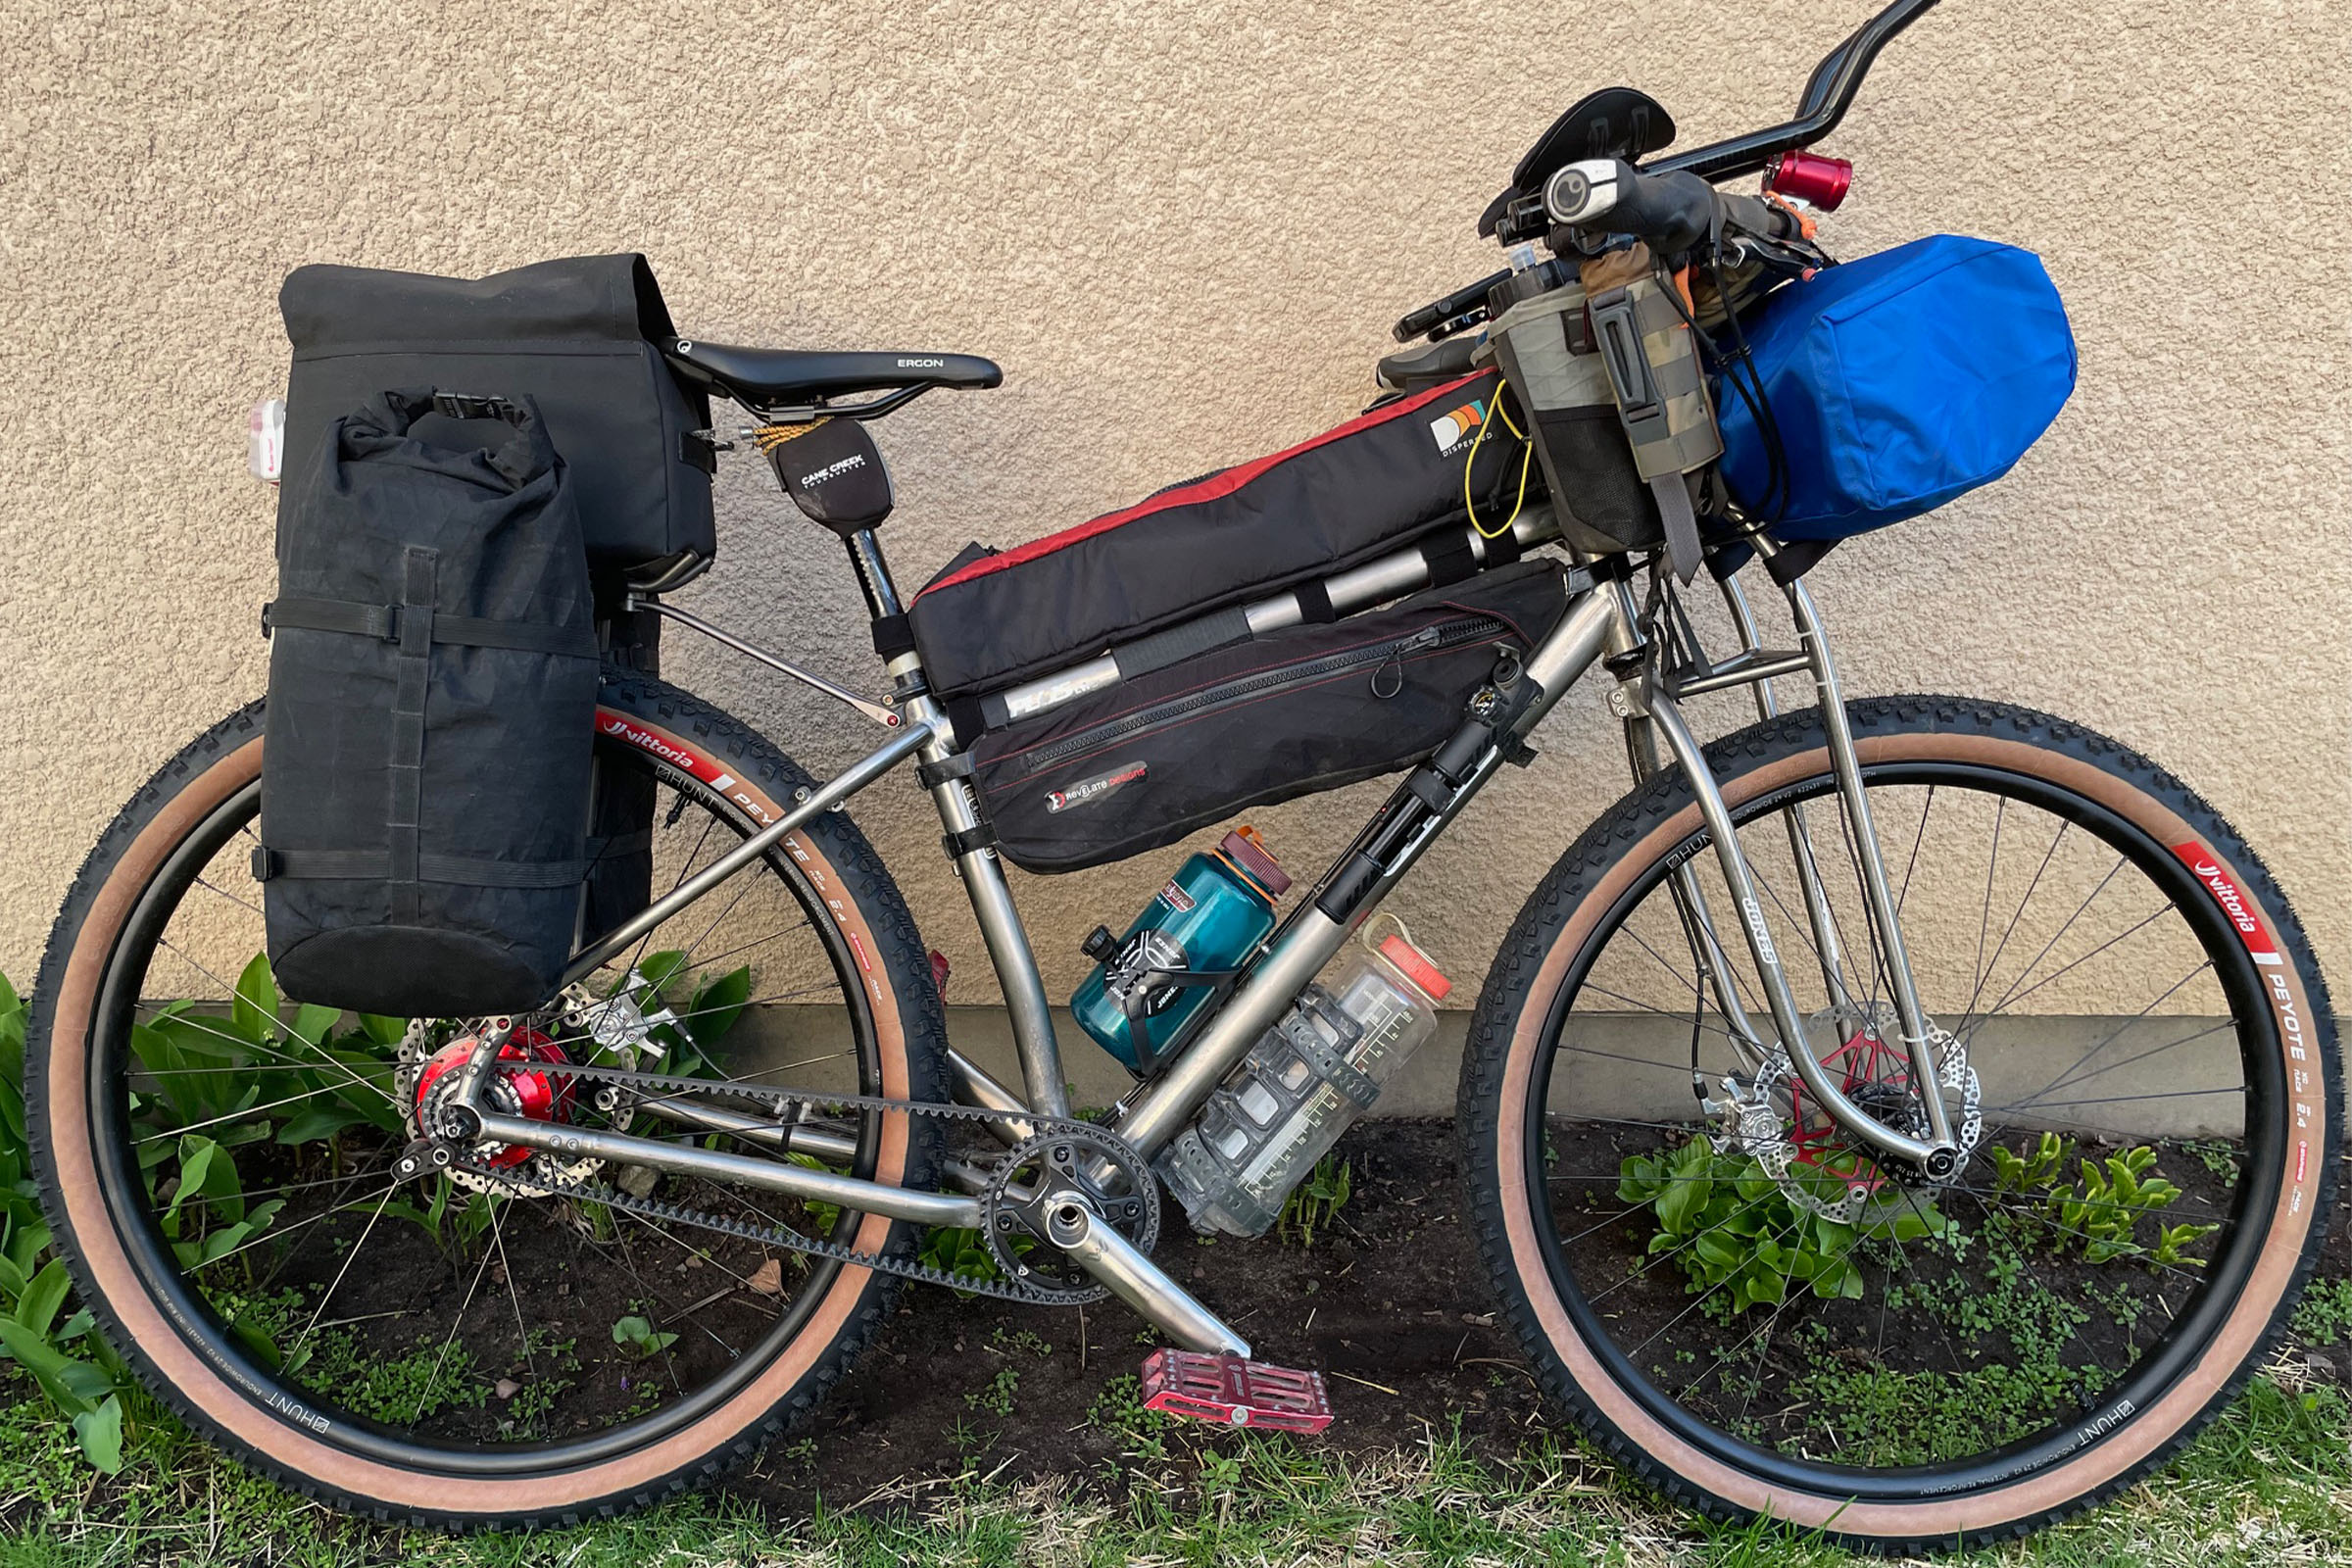
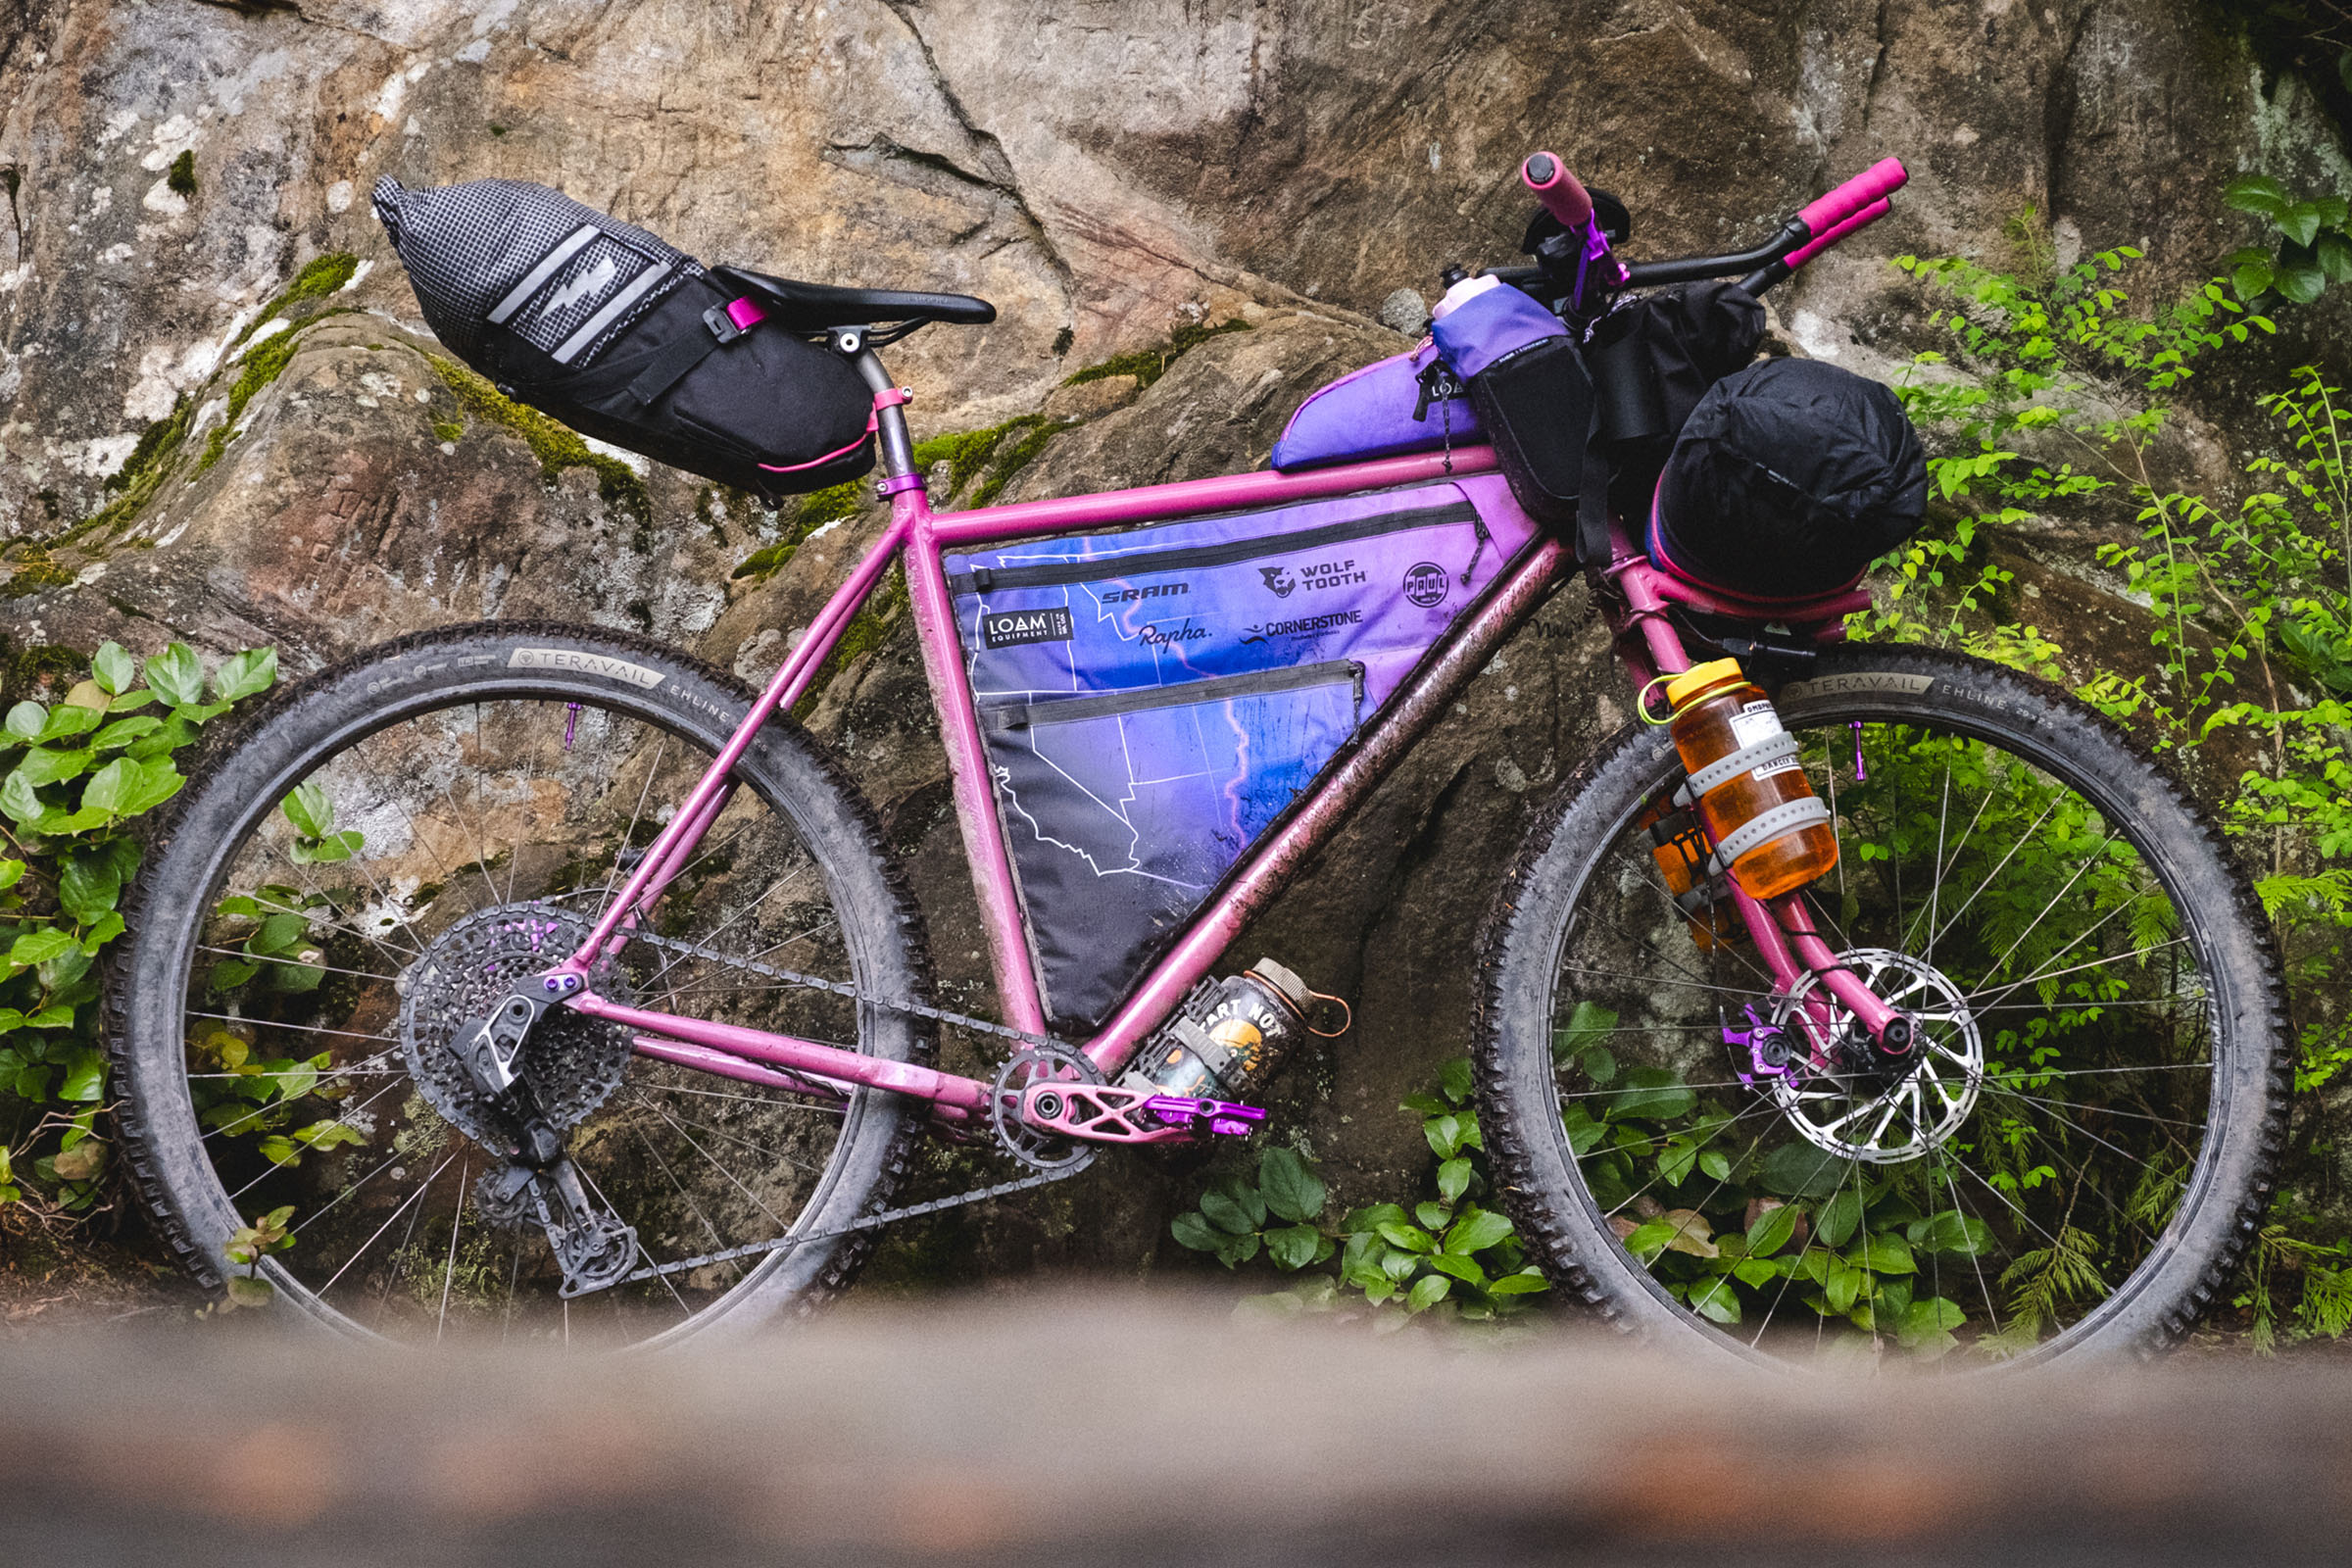
What’s a Tour Divide video without talking about cargo and, maybe more specifically, racks? Racks have been around since the first Divide race, but the debate about whether to trust a rack or stick with a seat pack is still going strong. That said, it’s been eye-opening to see how much things have shifted from last year. We were nearly 50/50 in 2024, with a slight edge to seat packs, but this year, racks saw a huge jump. Over 67 percent of racers used a rack setup, while just under 33 percent went with seat packs. That’s a pretty wild change.
Of the racks, 43 were Tailfin AeroPacks, followed by 12 Old Man Mountain racks. Tumbleweed had five racks in the mix, with various others making up the rest. On the seat pack side, there were 38 total, and Revelate was the most popular with 17, followed by Apidura.
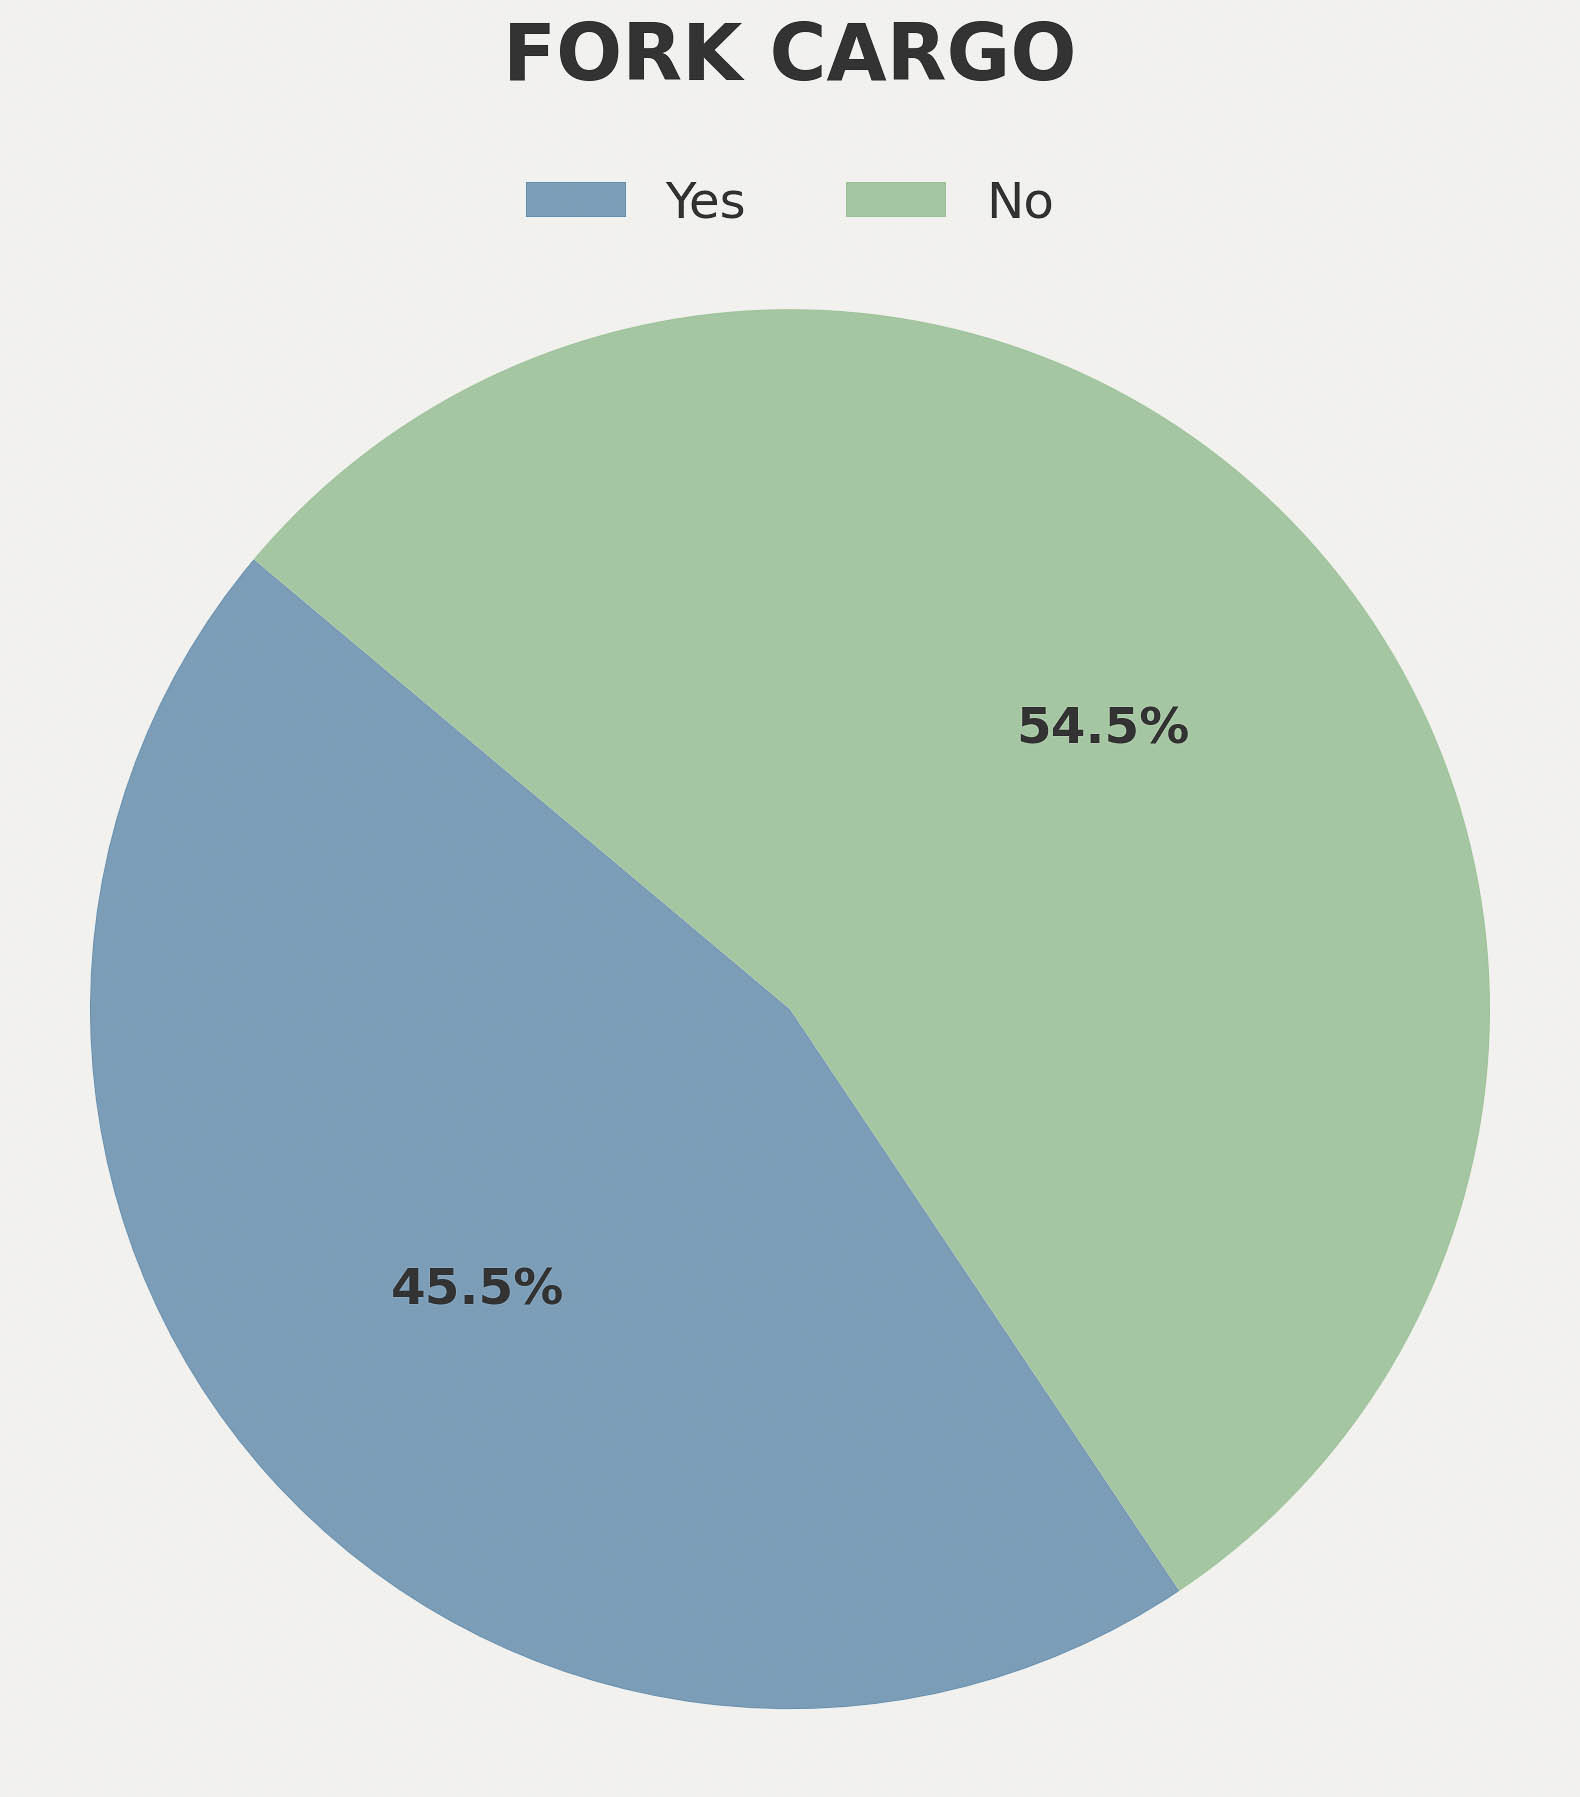
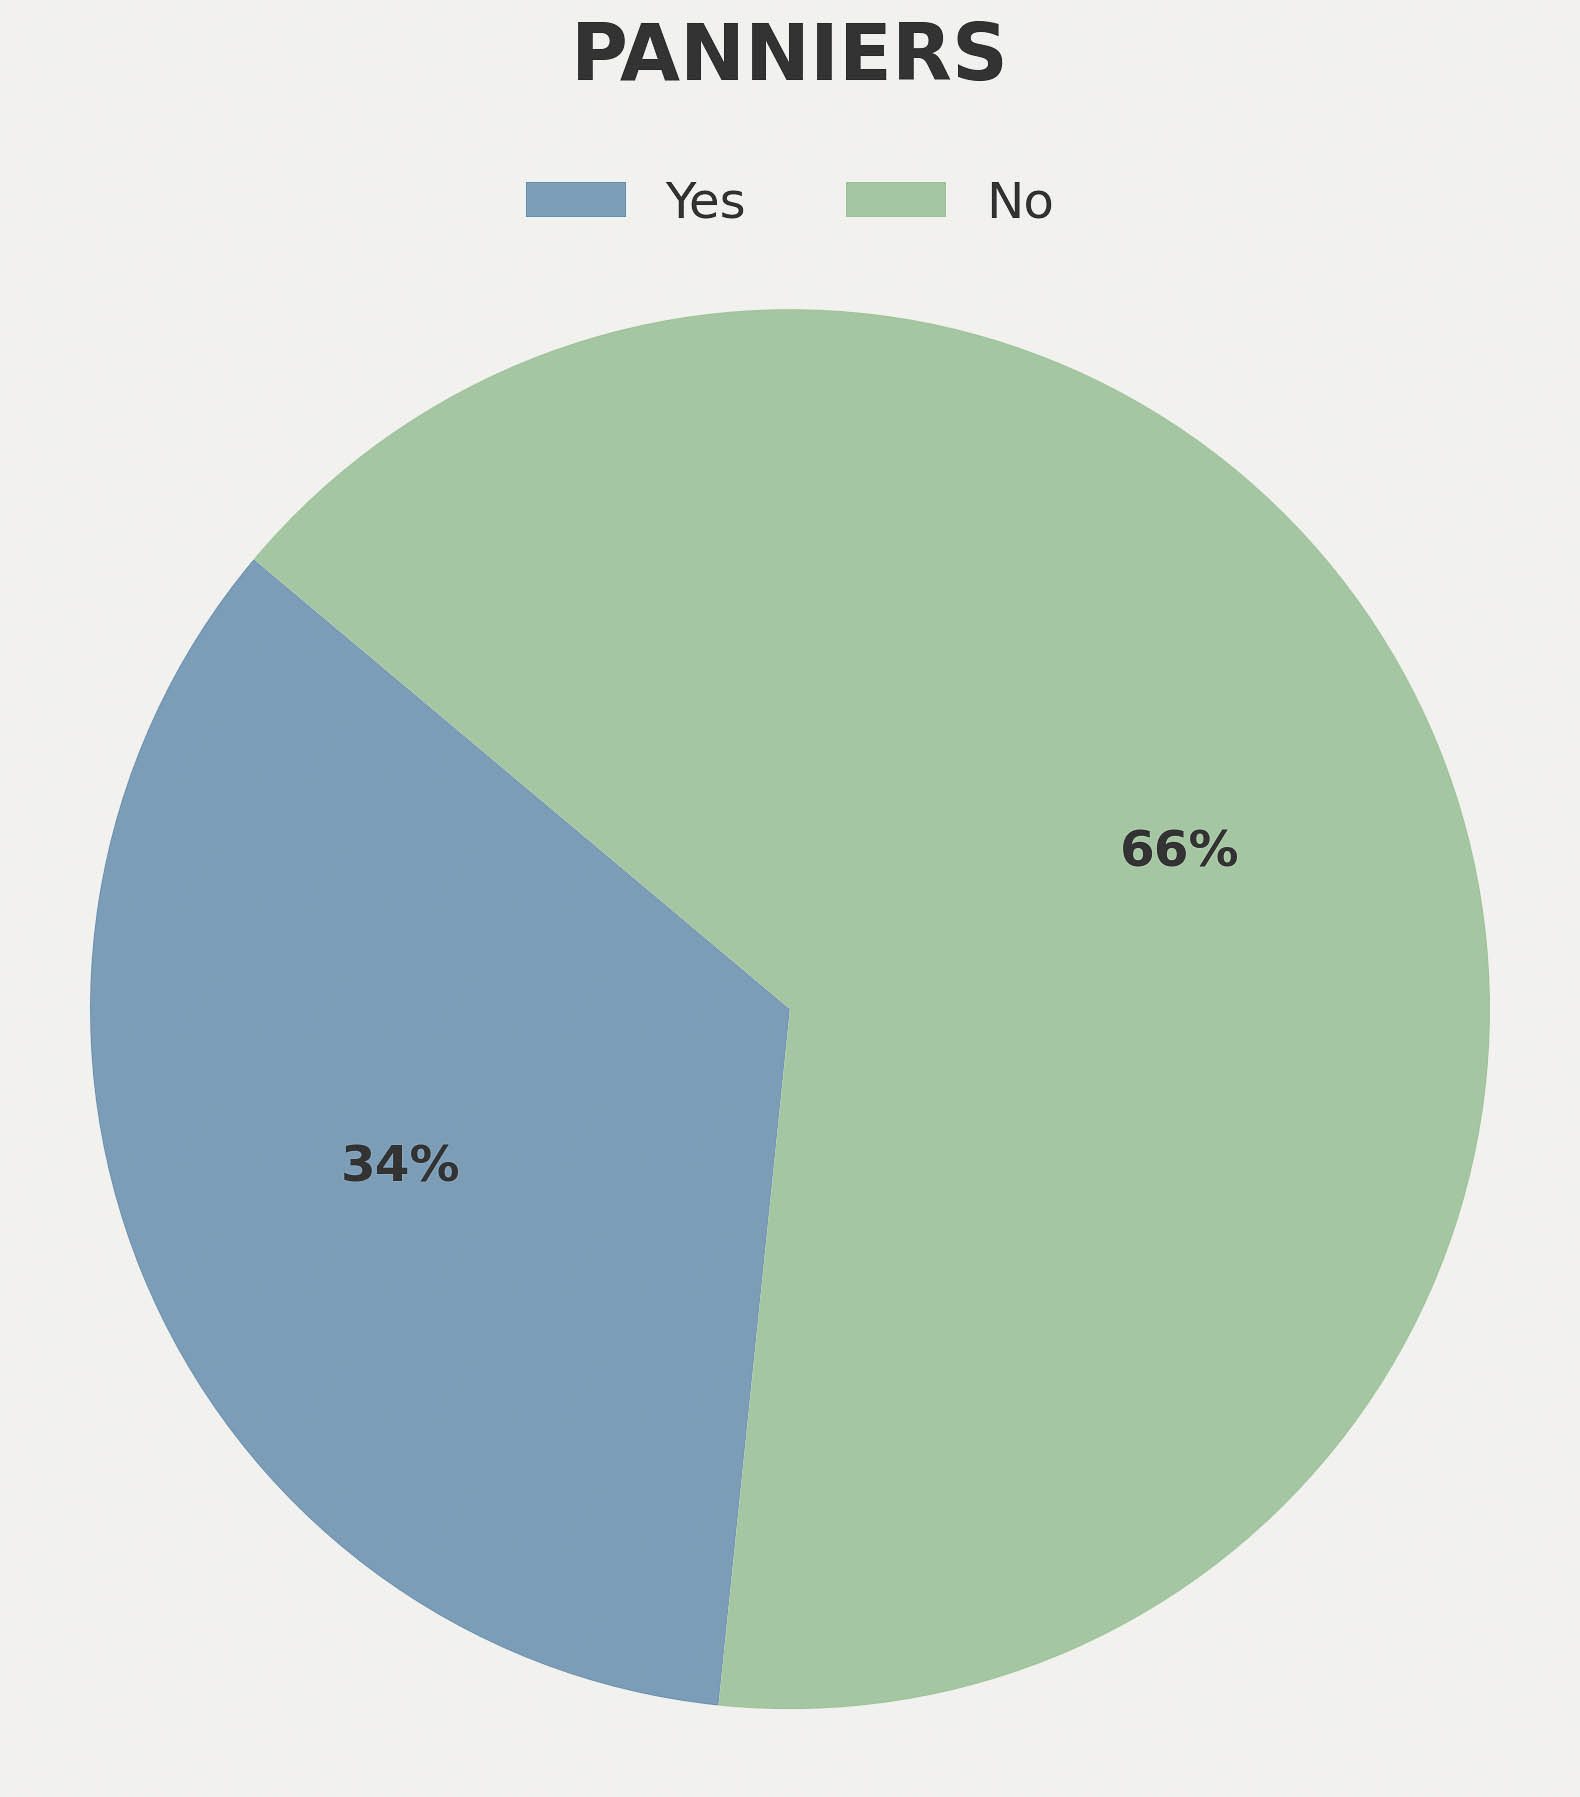
Of rack users, 40 folks actually ran a pannier on the rack or used it to mount smaller fork-style bags in the back. Speaking of fork mounts, folks love to make use of this area on the bike. Just over 45 percent of racers were running either fork packs, bottle cages, or some other form of fork-mounted cargo.
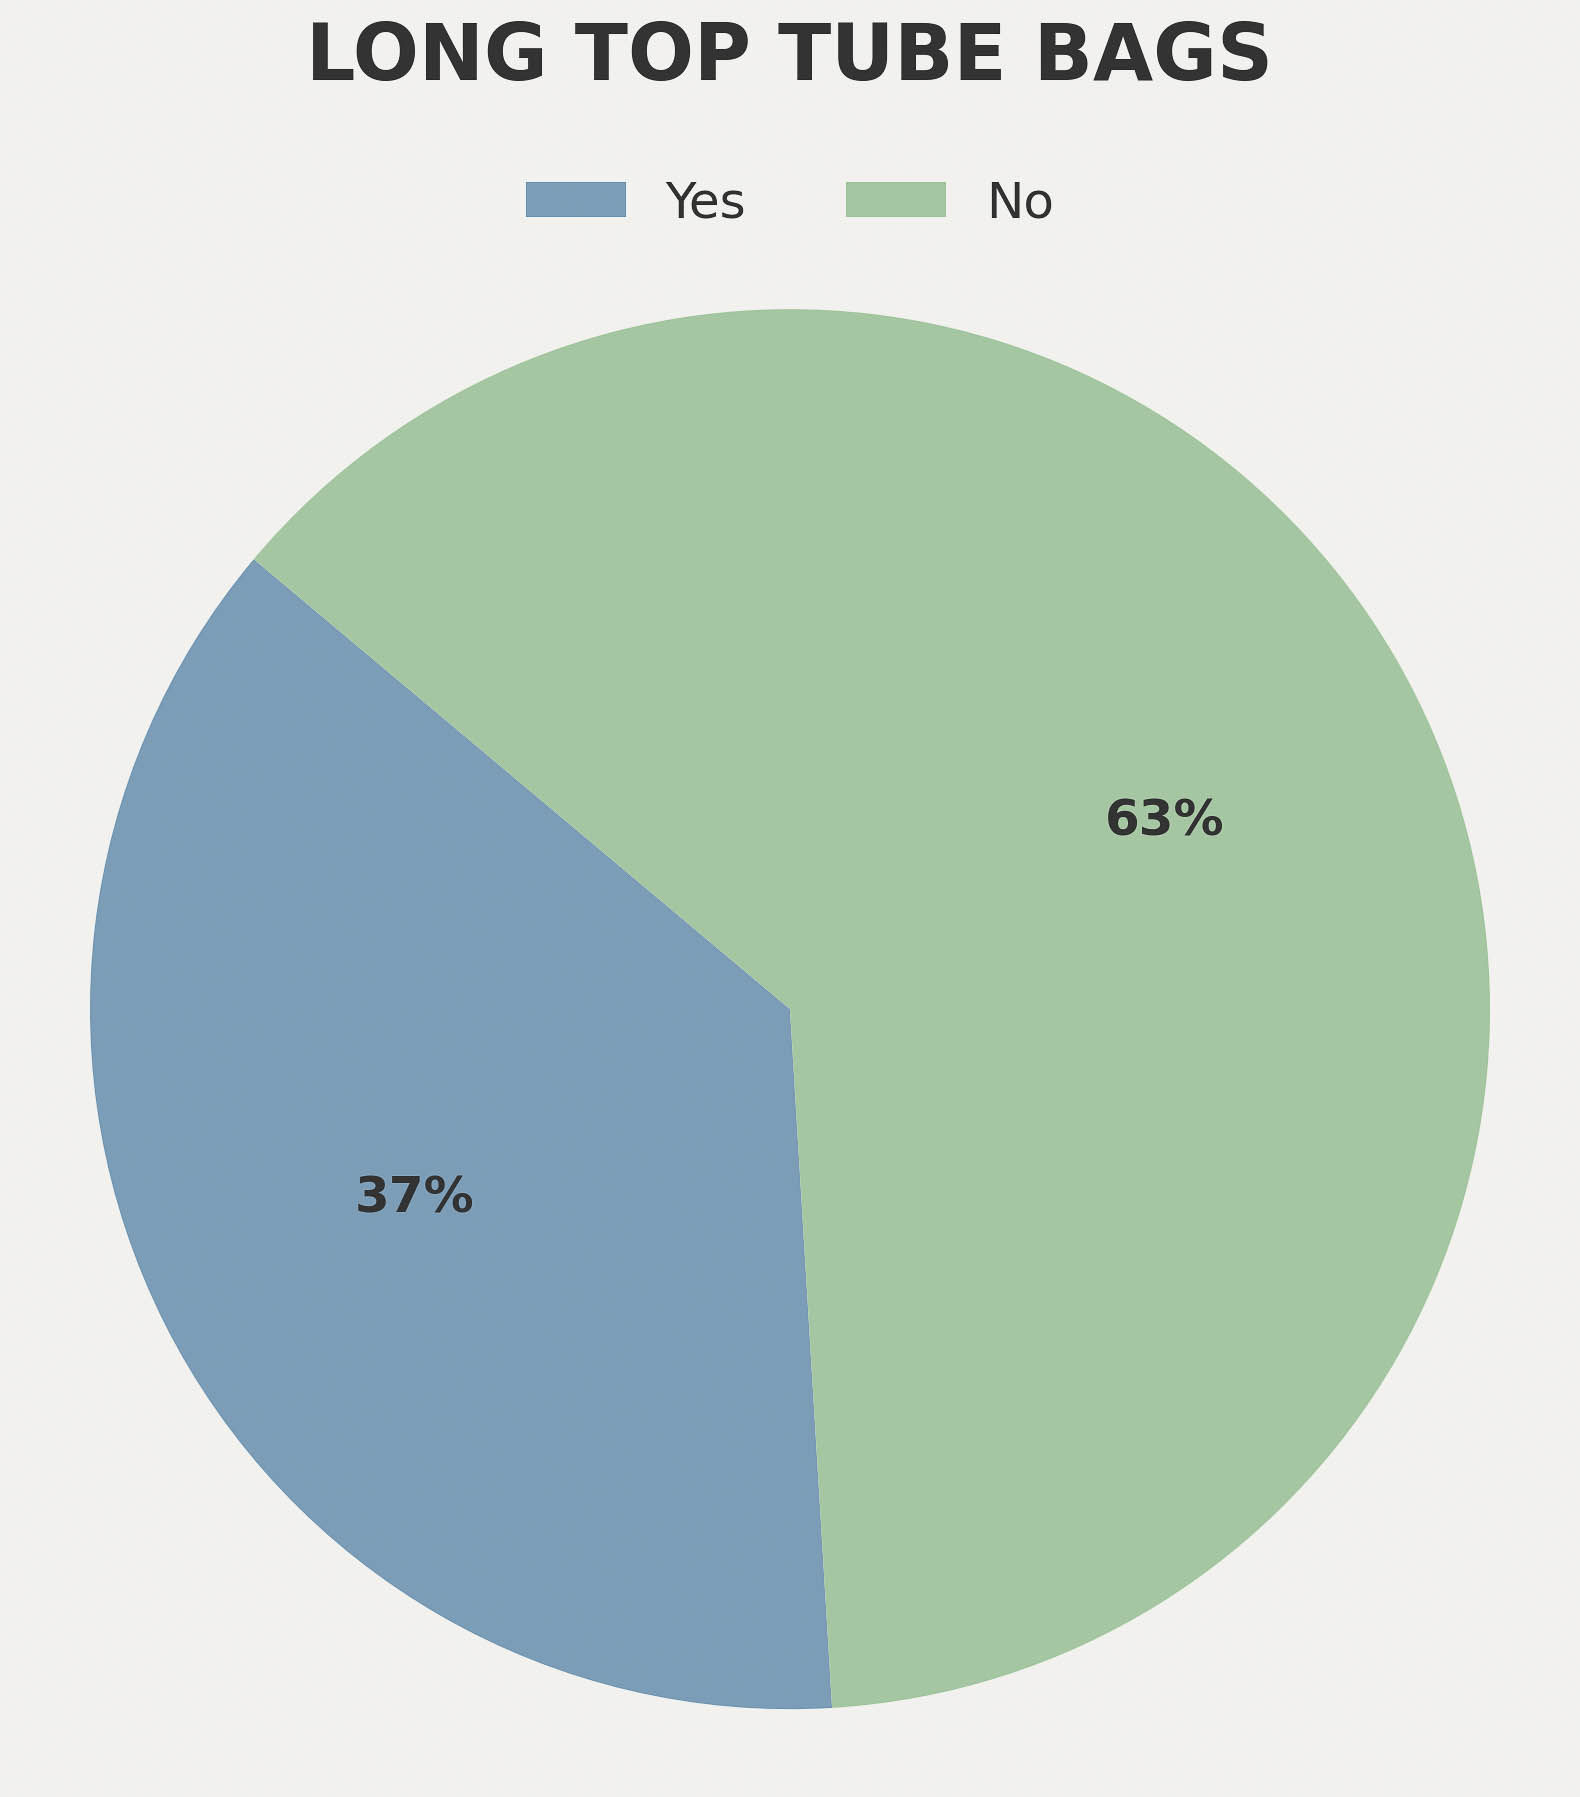
One new category I tracked this year was long top tube bags—the kind that run the full length of the top tube from the steerer to the seat tube. I noticed a bunch of them out there, so I started keeping tabs. In total, 43 racers used full-length top tube bags, many of which were custom or from Tailfin, Restrap, and Apidura. And while we’re on the topic of bags, there were 11 full-kit loyalists this year (folks who ran the same brand for all their bags). Some were clearly sponsored, but a few simply chose to keep it clean and uniform. This number was down from last year, which I appreciate, as I love spreading the wealth.
Random Findings
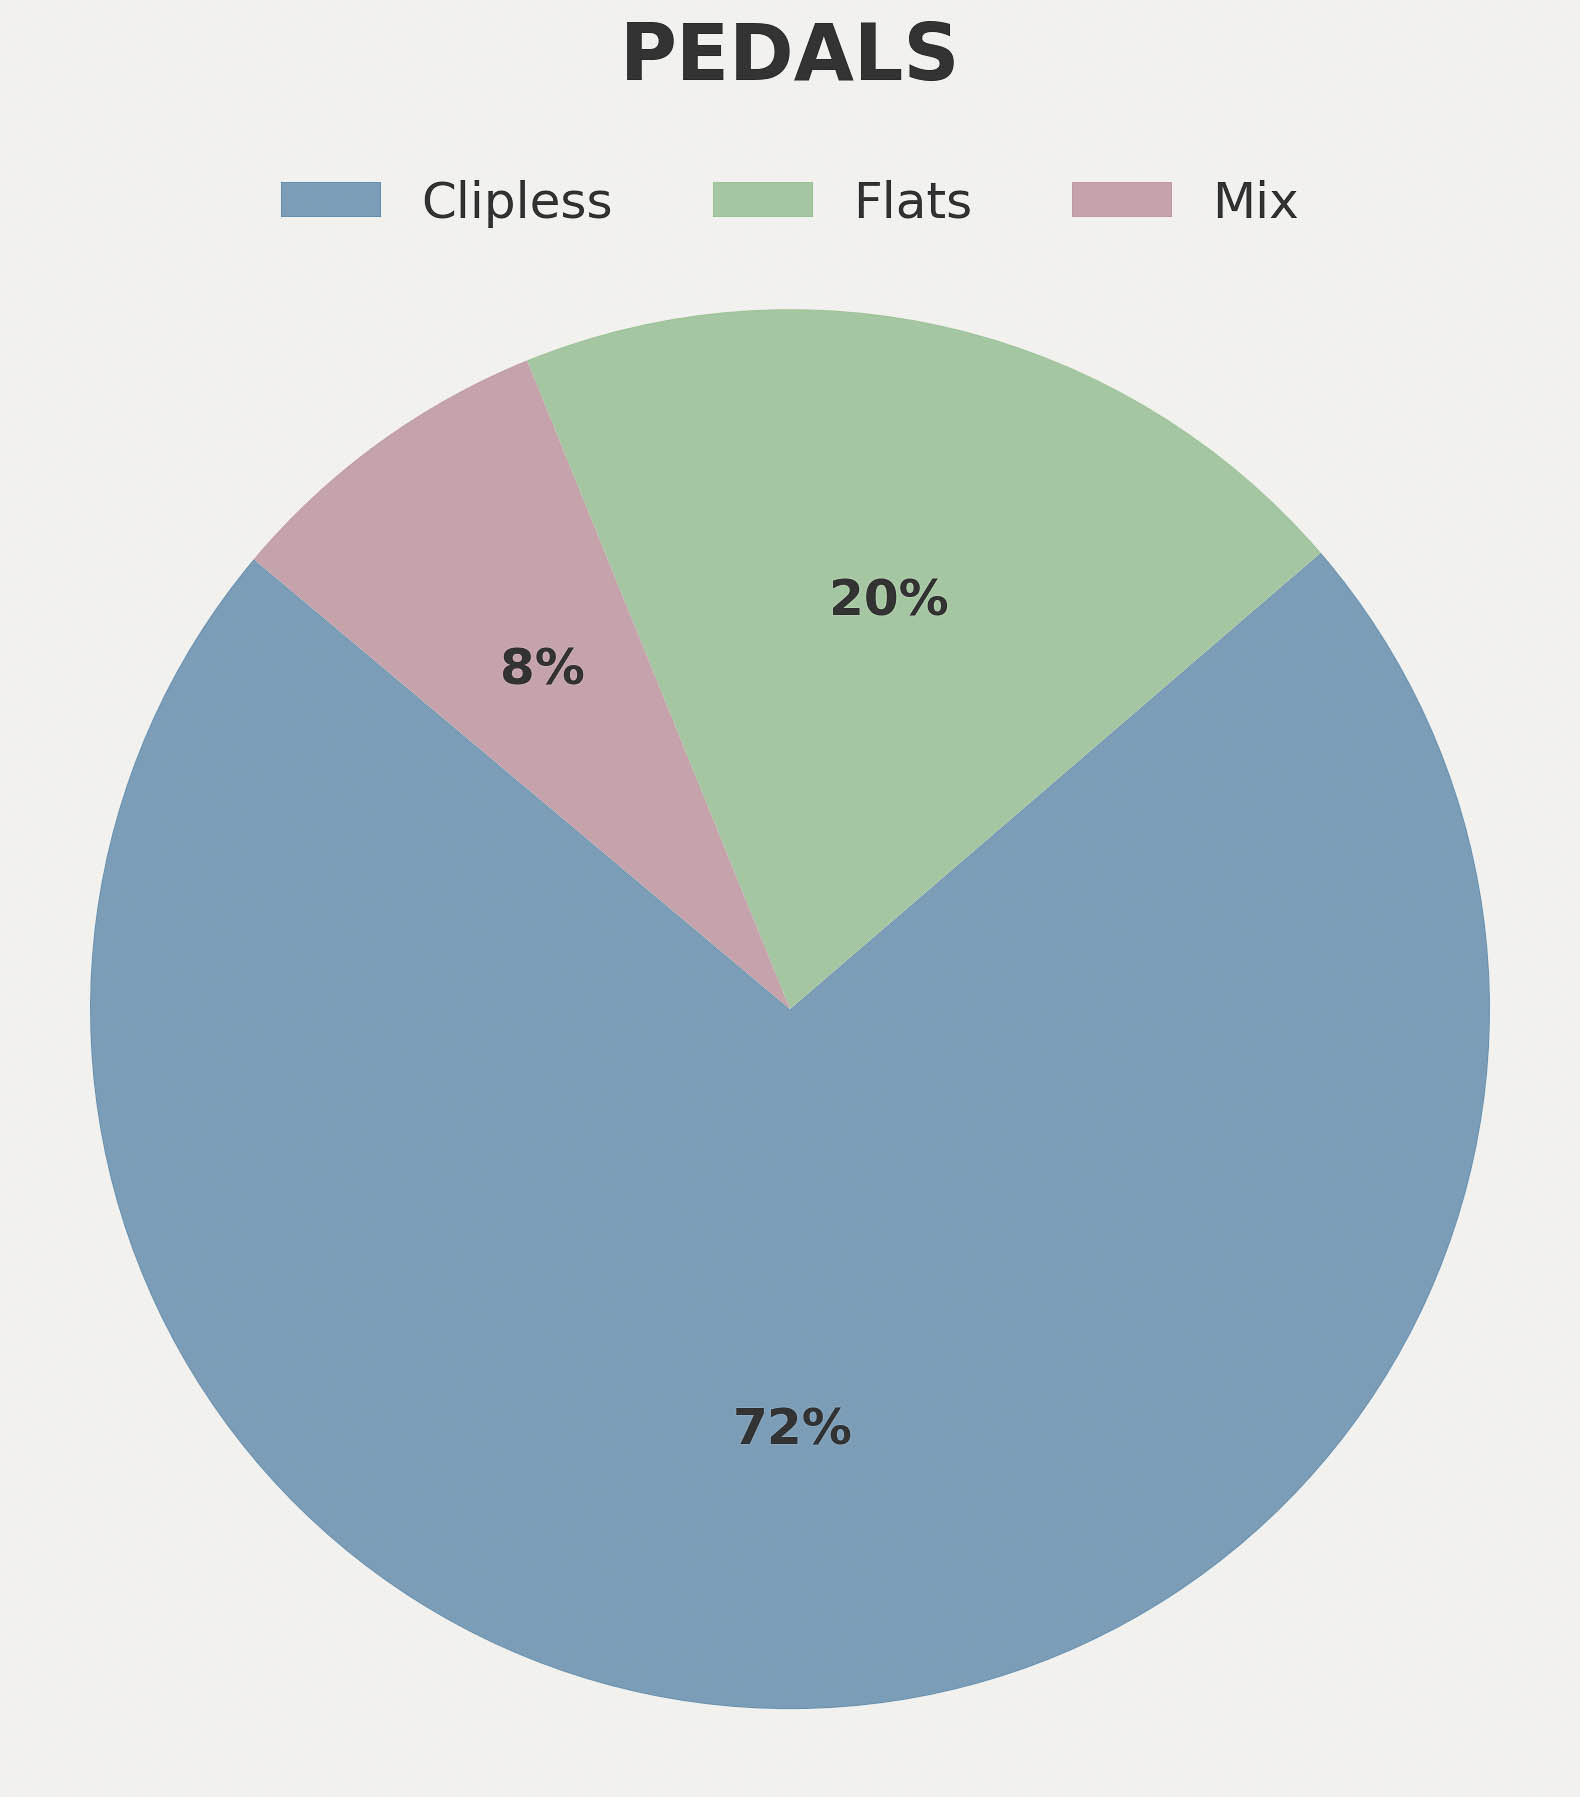
Before we get into the people, I want to highlight some interesting things in the data. Starting with pedals, over 72 percent were using clipless, most of which were the Shimano SPD system. That was followed by flats at almost 20 percent, and then a mix of dual-sided pedals (flats on one side, clipless on the other) and eight percent.
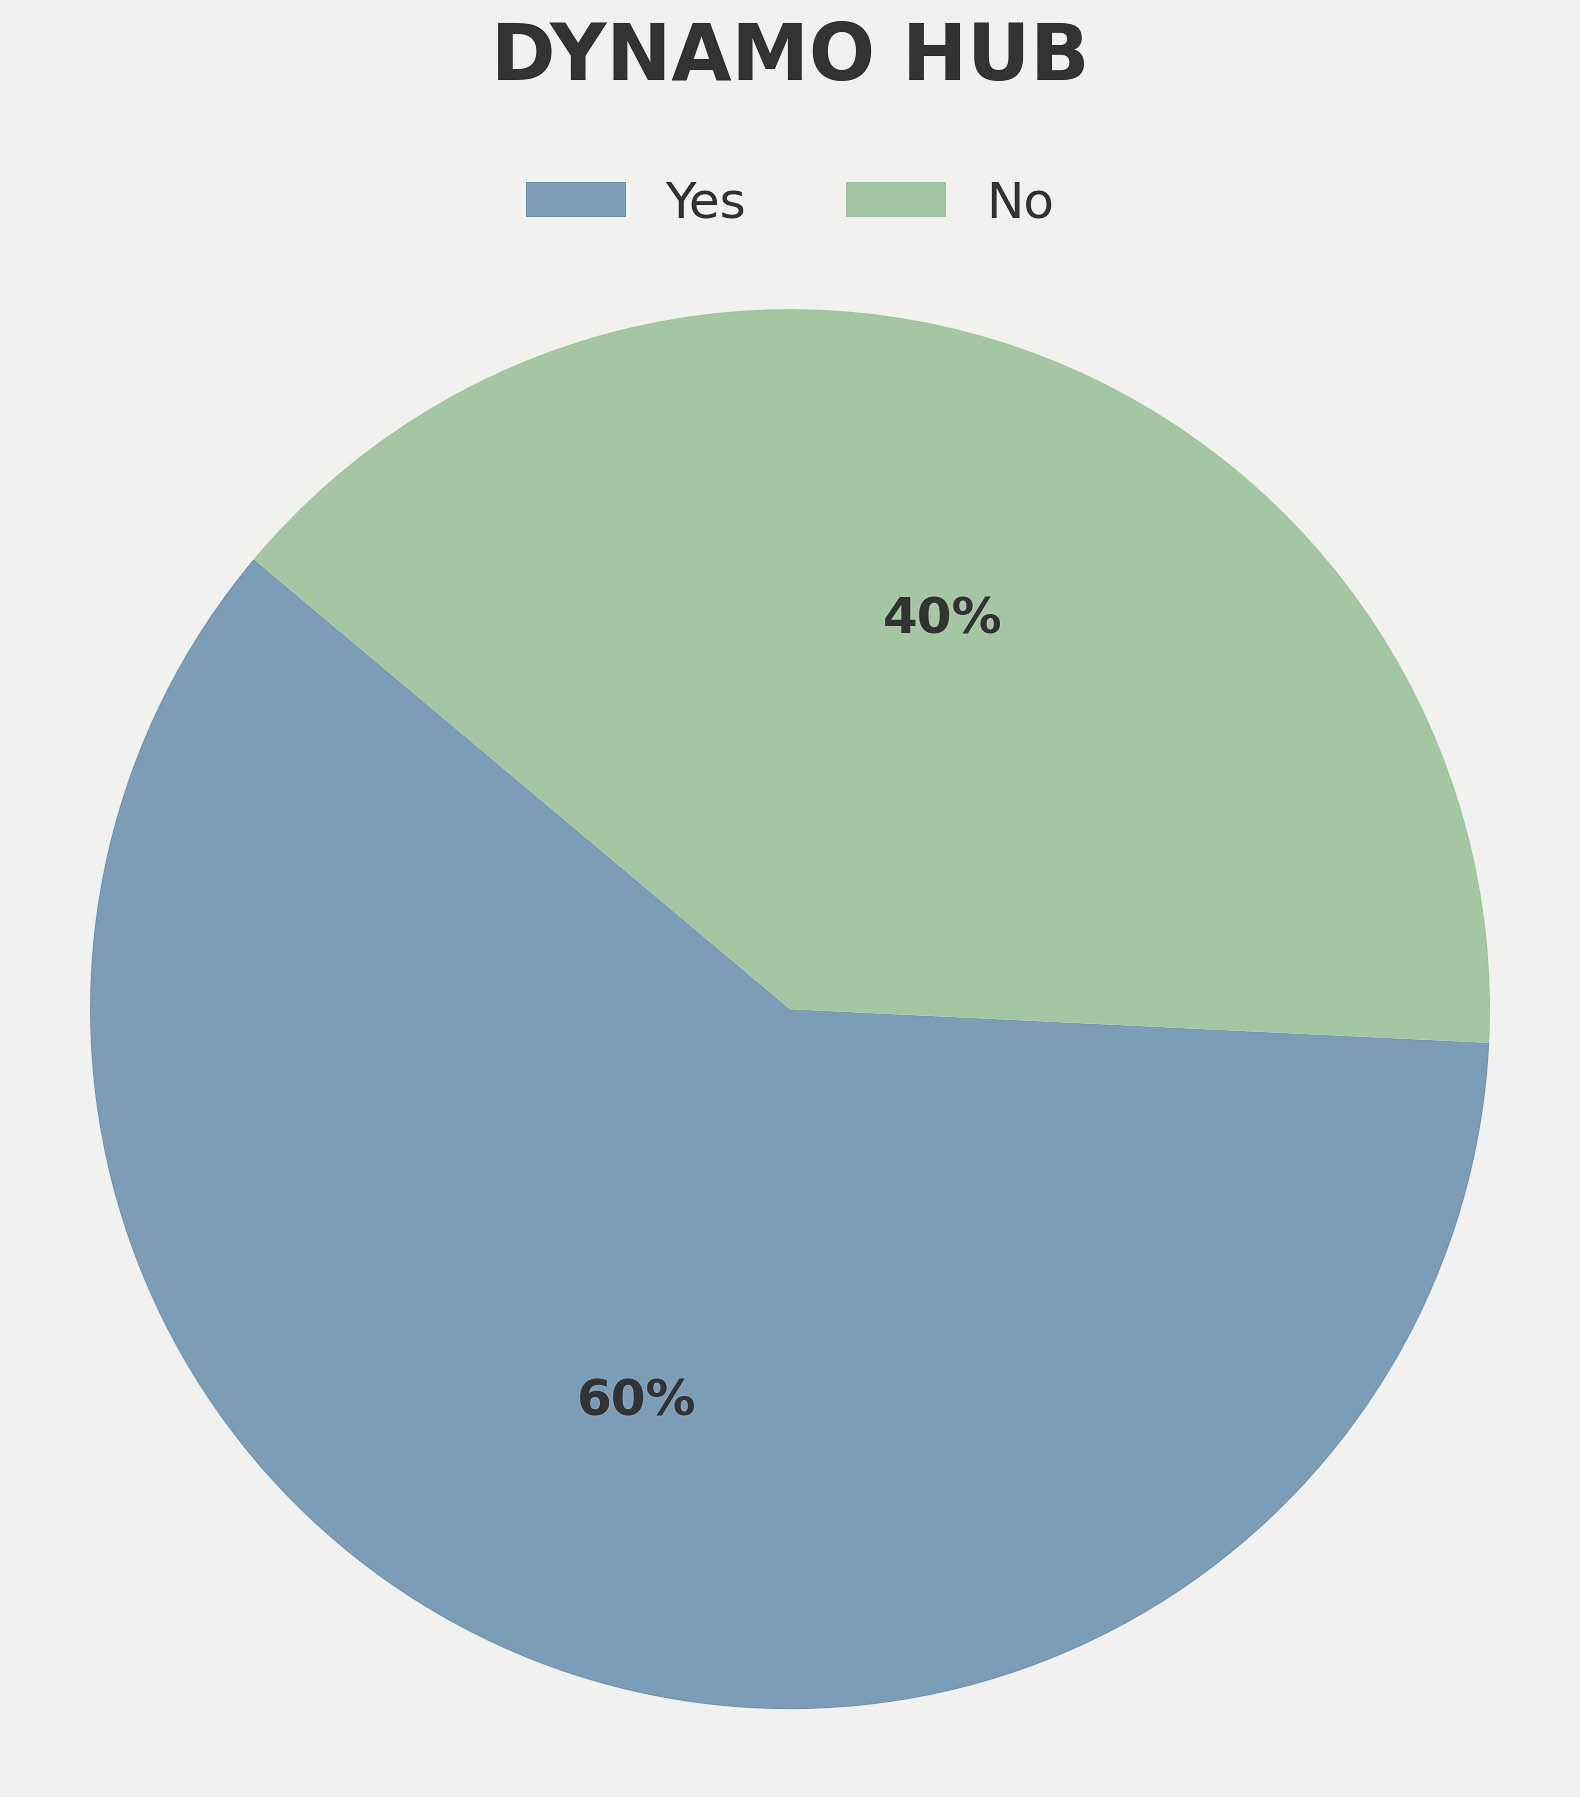
We asked riders again if they were using a dynamo hub, and 60 percent of them were. Surprisingly, dynamo usage is down eight percent from 2024. That said, SON Hubs are very popular; there were 67 folks running them and only two using SP and 1 rocking a Kasai dynamo. And while we didn’t specifically ask for lighting setups, I pulled as much as I could from the photos and details provided. I counted 34 KLite systems, 24 Sinewave systems, and 11 Fenix lights, so two popular dynamo systems and one battery-powered setup.
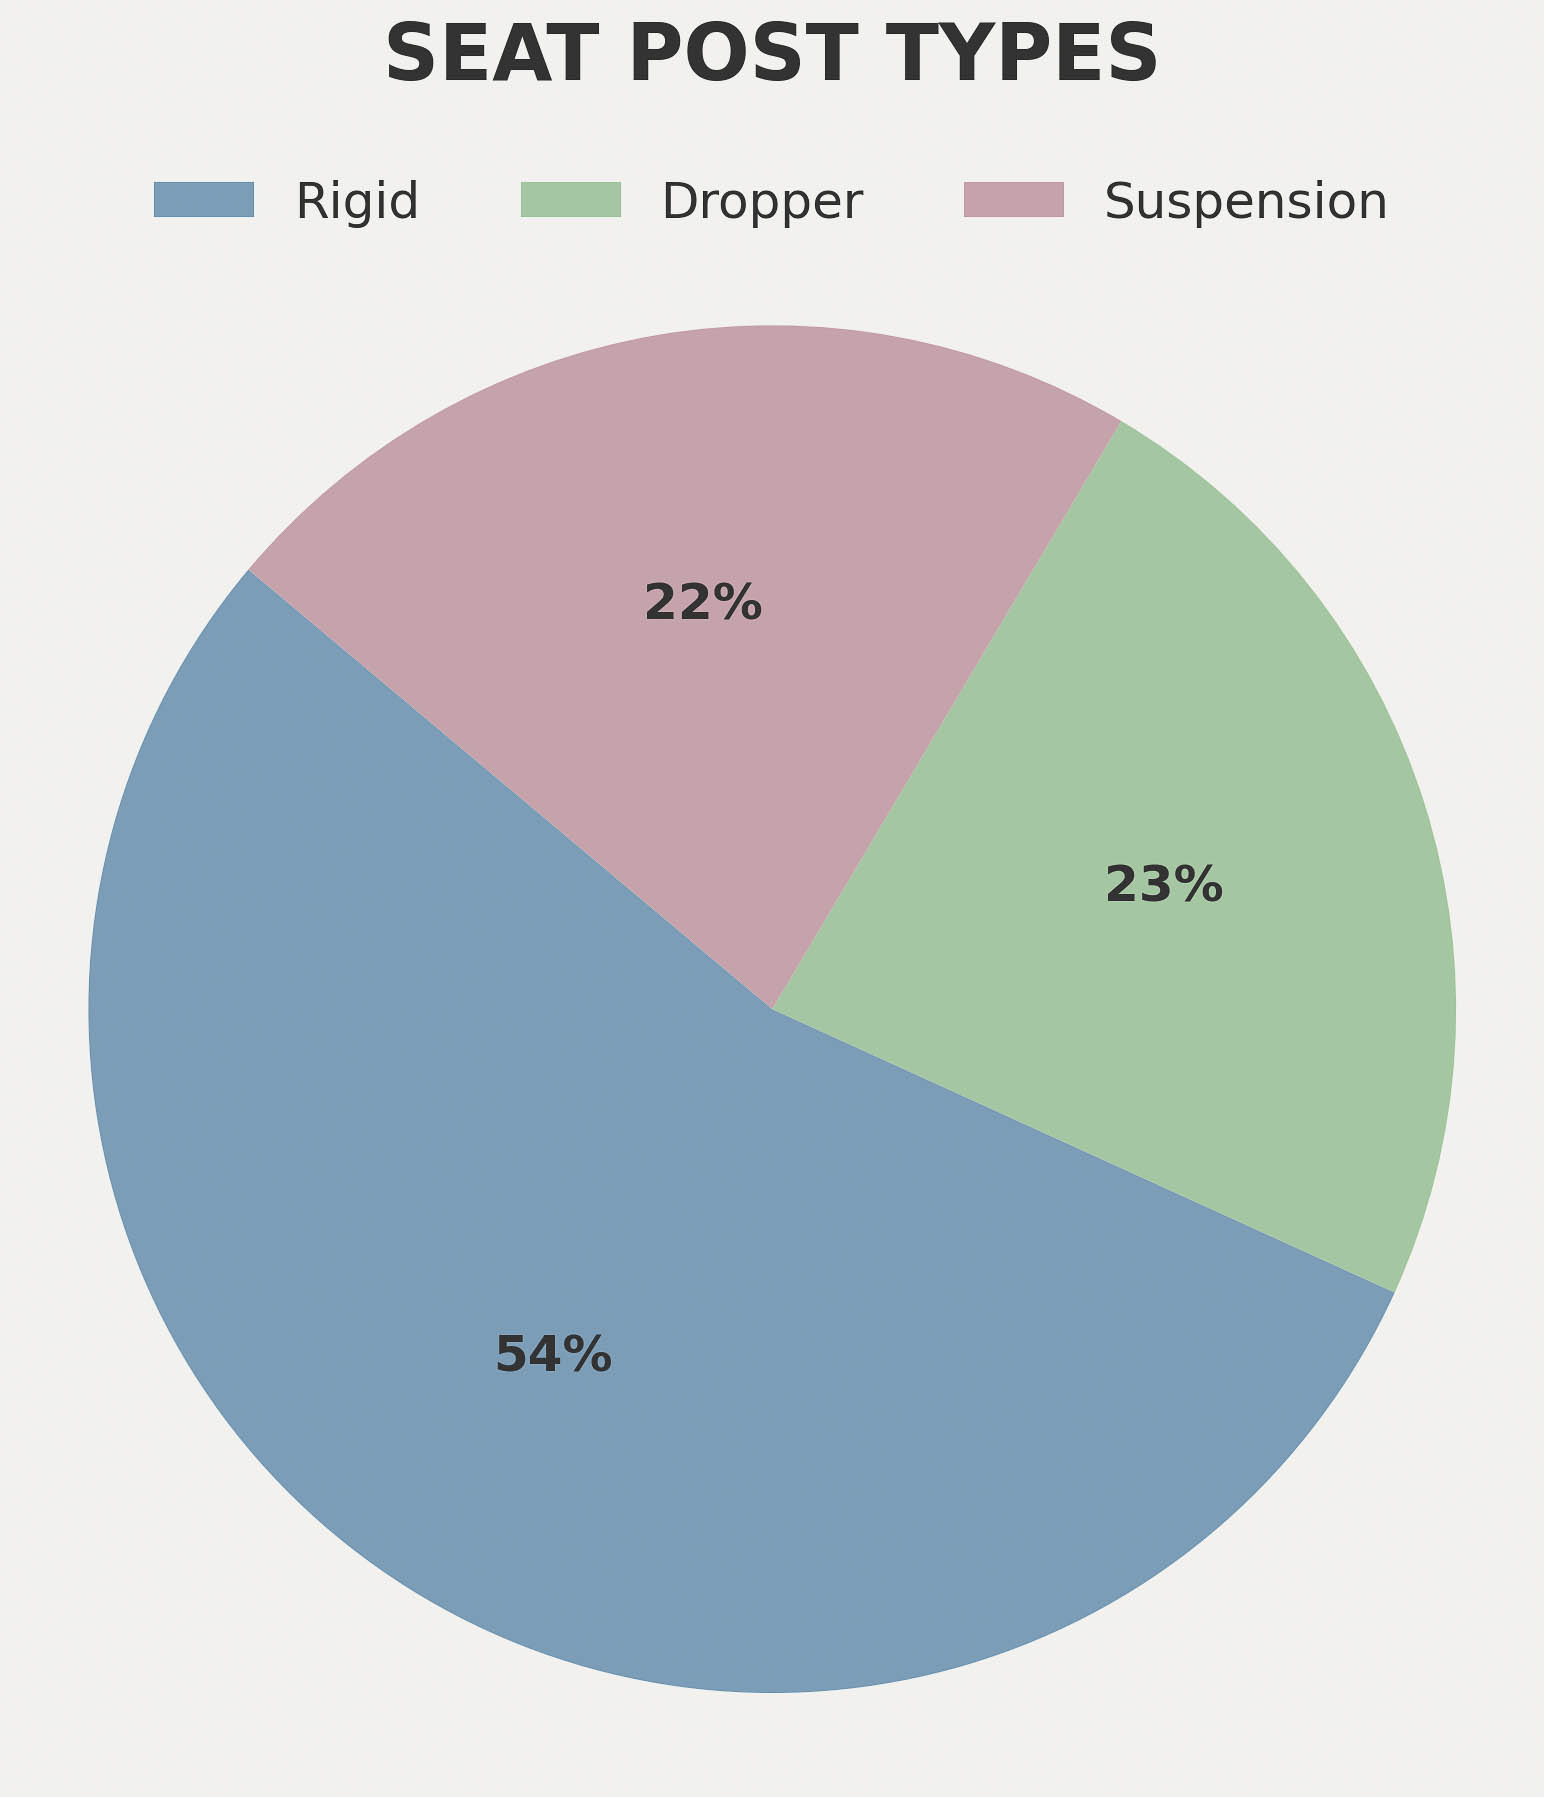
As for seatposts, 63 riders used rigid posts, 27 had droppers, and 26 used suspension seatposts. You might assume that more rack users were also running droppers, but there was no strong correlation between droppers and racks versus droppers and seat packs.

Finally, navigation. This part was especially interesting. Garmin led the way with 66 riders using their GPS devices, but Coros disrupted things by taking second place with 23 riders, which is impressive for only being on the scene for about a year. Not too far behind was Wahoo with 19 riders. Of the 116 riders, 62 were using a solar-charging head unit with Garmin and Coros units. I love seeing this technology, and this application is perfect. I wouldn’t be surprised if two-thirds of the group are running GPS units with solar charging capabilities next year.
People
Let’s get into the riders. According to Trackleaders, which is an amazing resource that lets us observe the race in real-time, there are 236 total racers on the tracker, and 226 of those set off last Friday as part of the grand depart, which happens the second Friday of June each year. Of the grand depart riders, there were 207 men racing and 29 women. While that might seem low for the women, that’s an eight-woman increase from 2024, which is great to see.

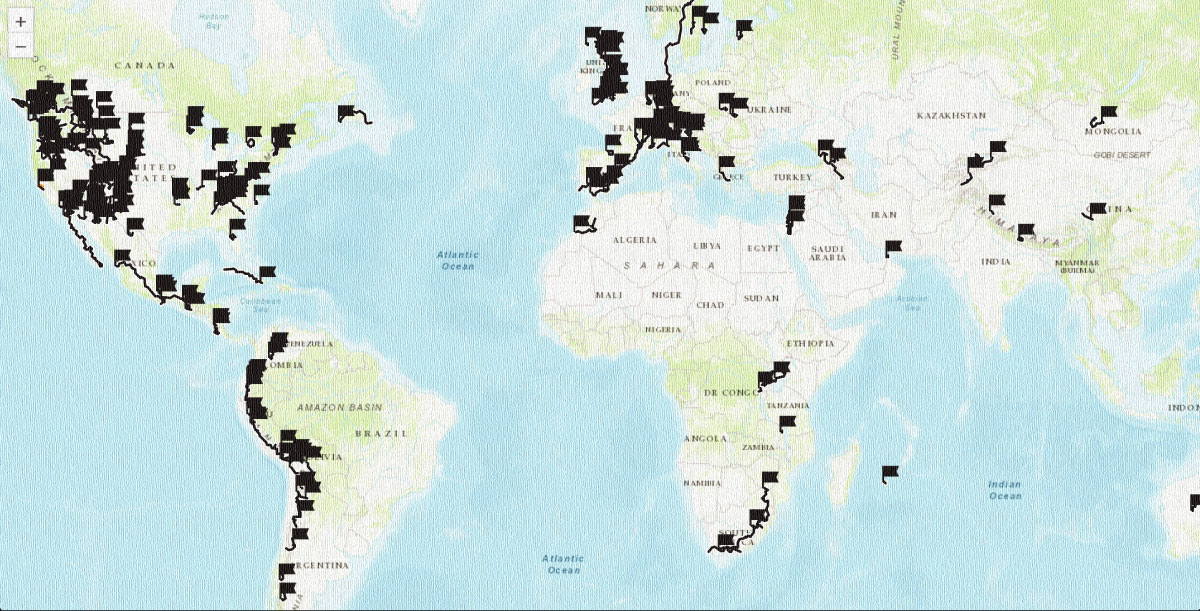
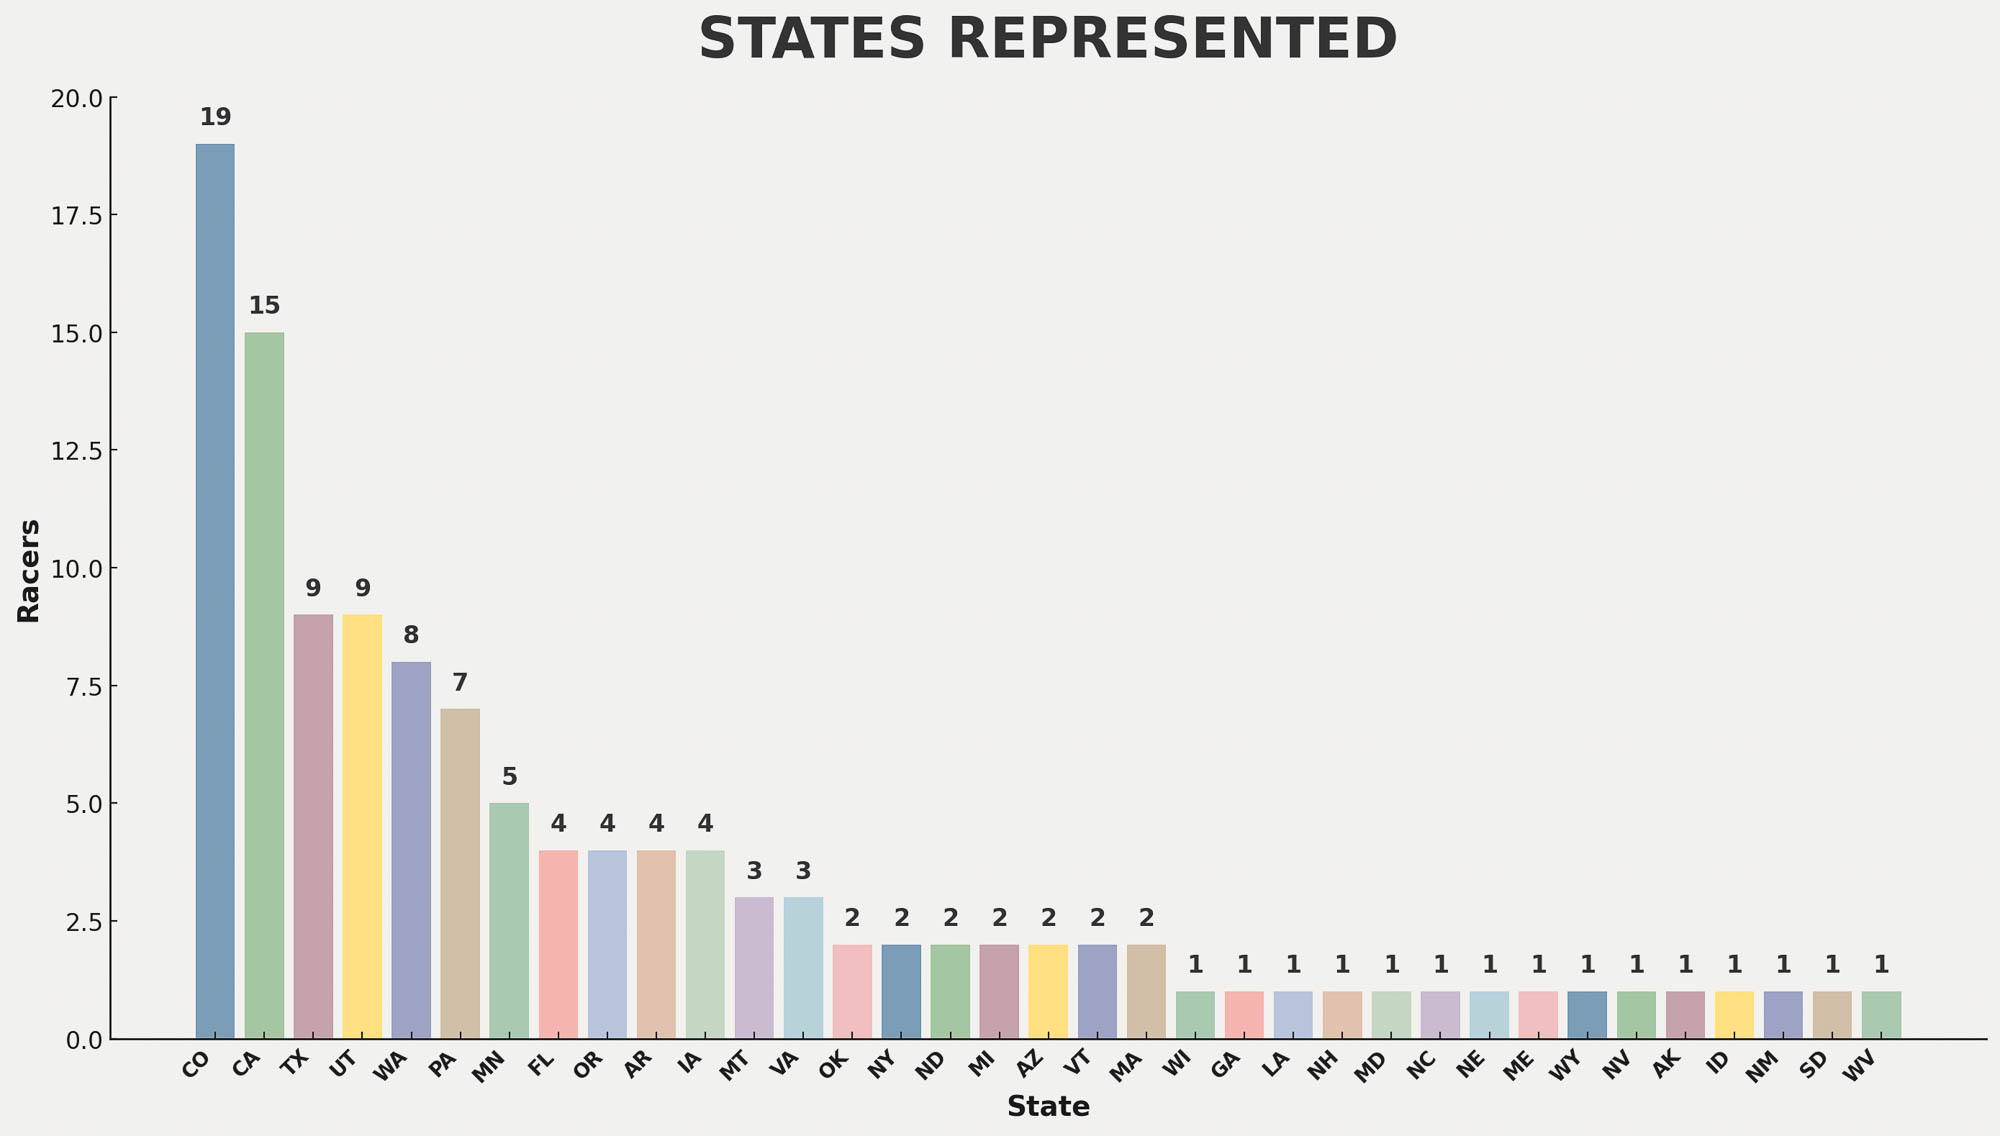
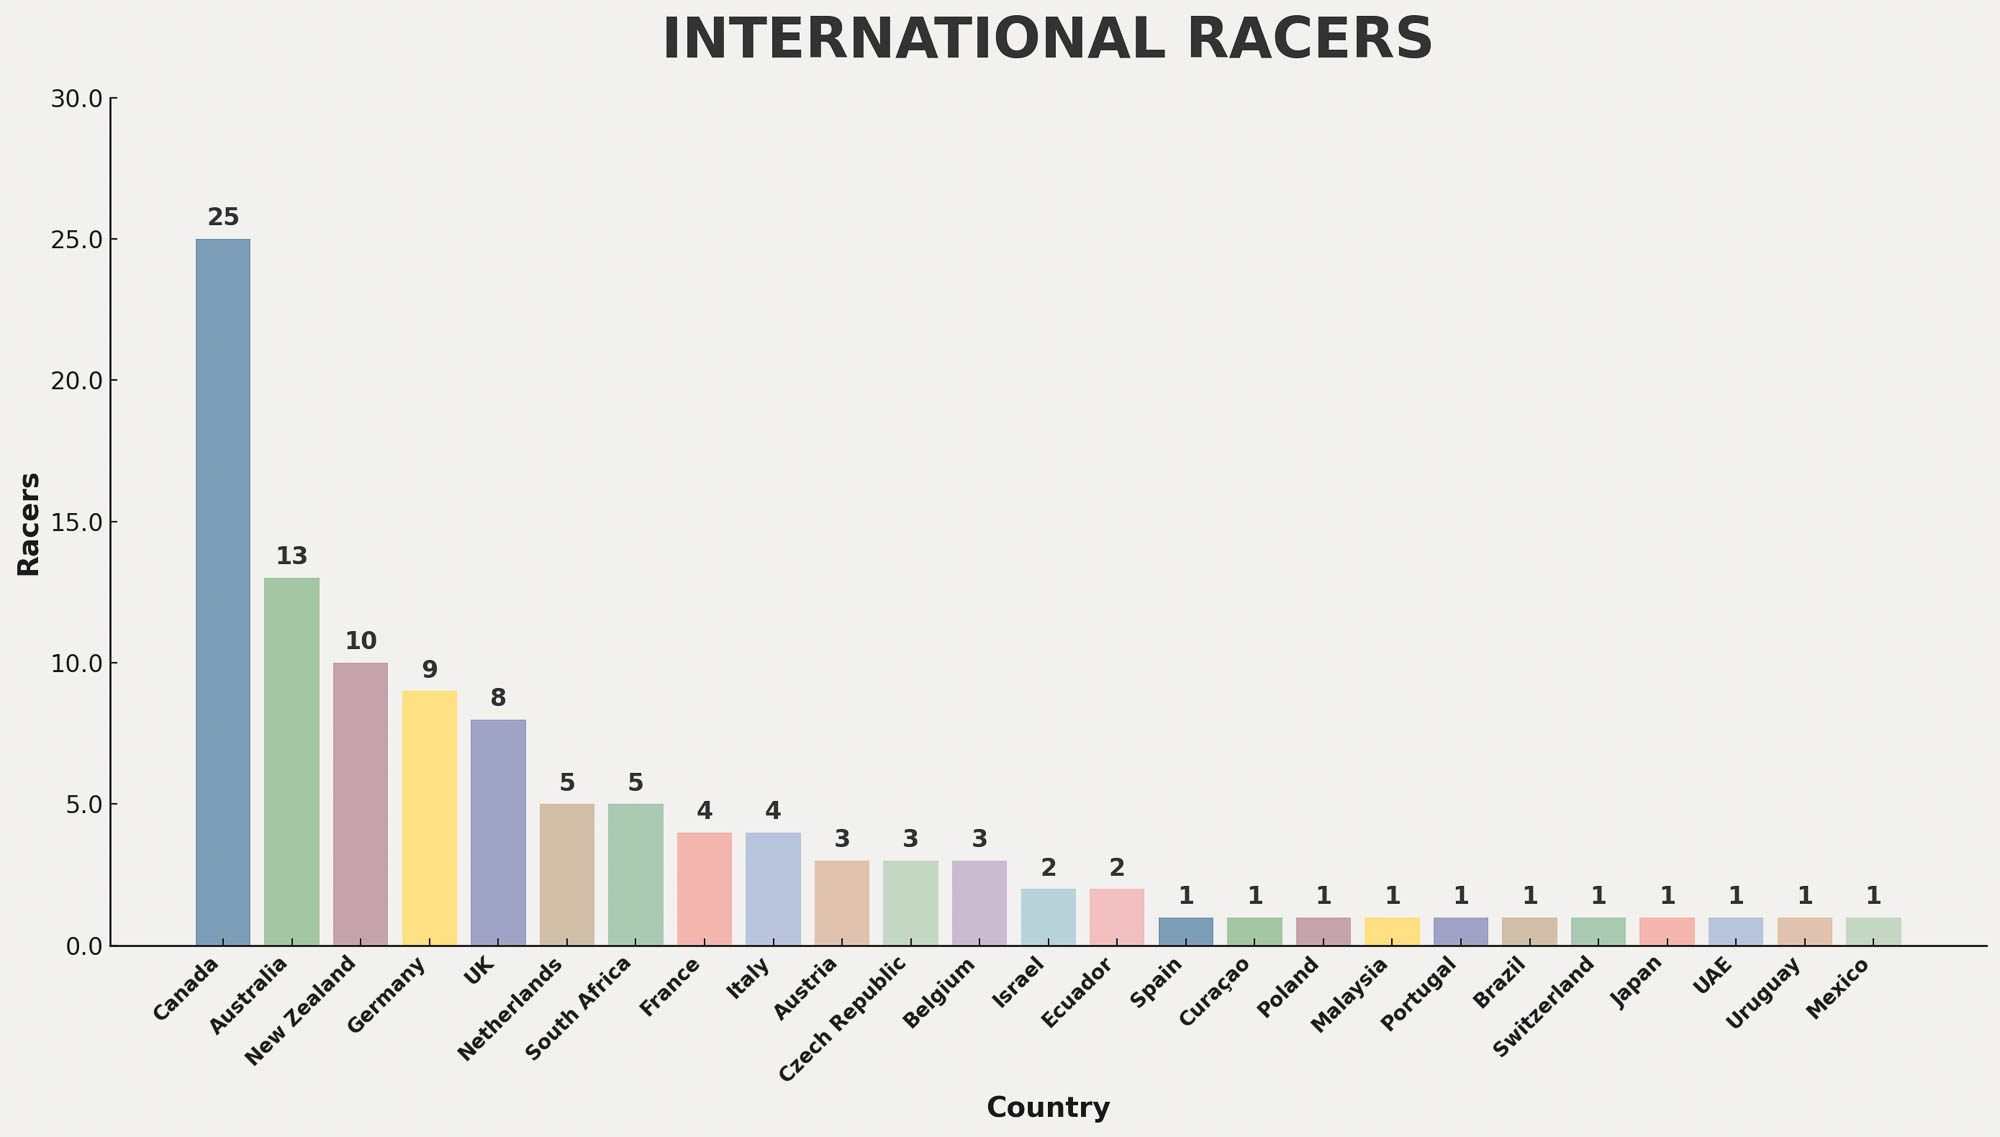
As I’ve mentioned before, this has truly turned into a worldwide race, with folks coming from all over the globe. Most participants come from the United States, which makes sense, followed by Canada, Australia, New Zealand, Germany, and the UK. But there are racers from many different parts of the world. Of the folks racing from the United States, the most represented state was Colorado with 19, followed by California, then Texas, Utah, and Washington.
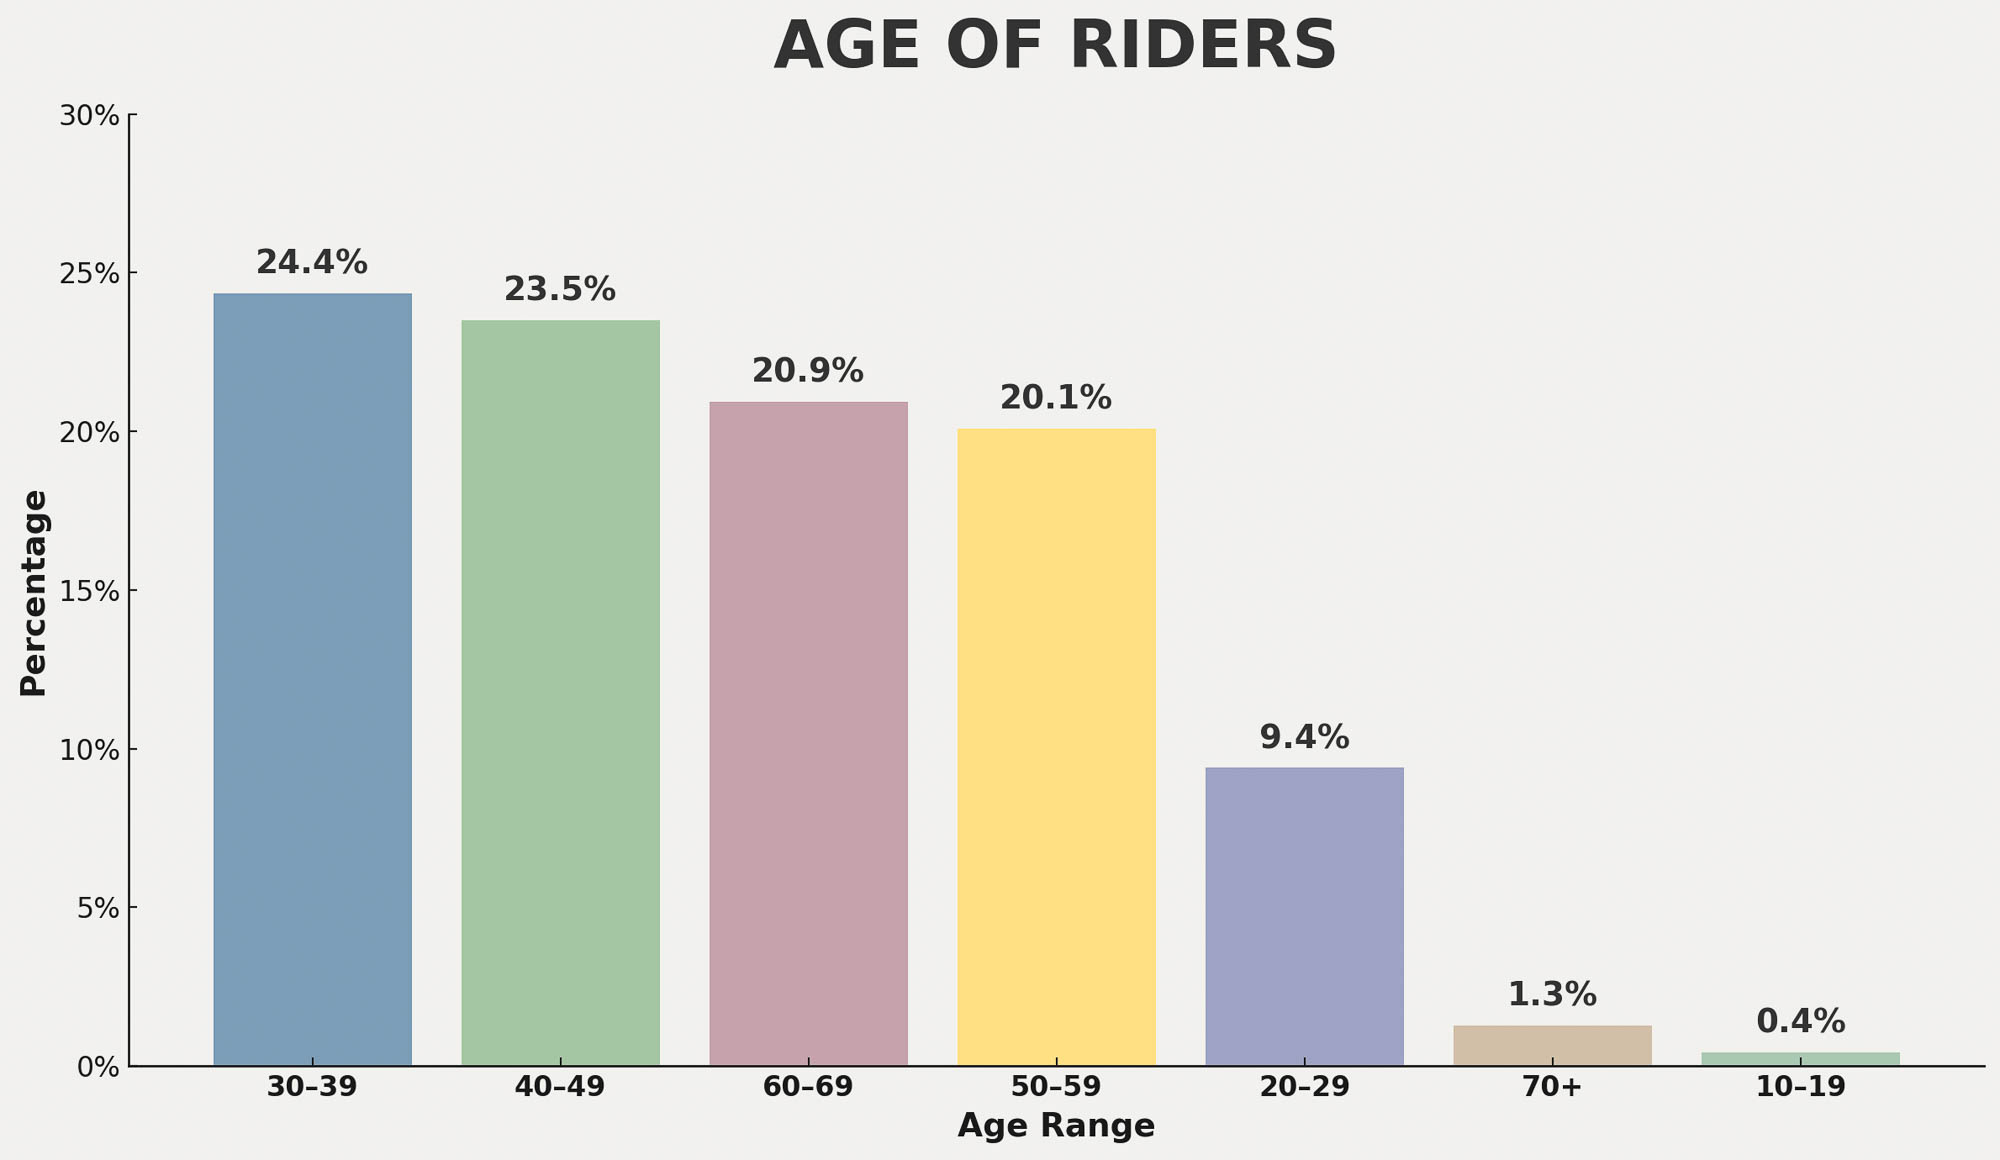
Getting into age groups here, and as was the case last year, there isn’t much disparity in numbers between racers in their 30s to 60s. This year, the 30 to 39 group was the largest at 24.4 percent, followed by the 40 to 49 group at 23.5 percent, the 60 to 69 group at 20.9 percent, and the 50 to 59 group at 20.1 percent. Then there’s a steep drop-off, with only about 9 percent in the 20 to 29 age group, three individuals over 70, and just one in the 10 to 19 age group.
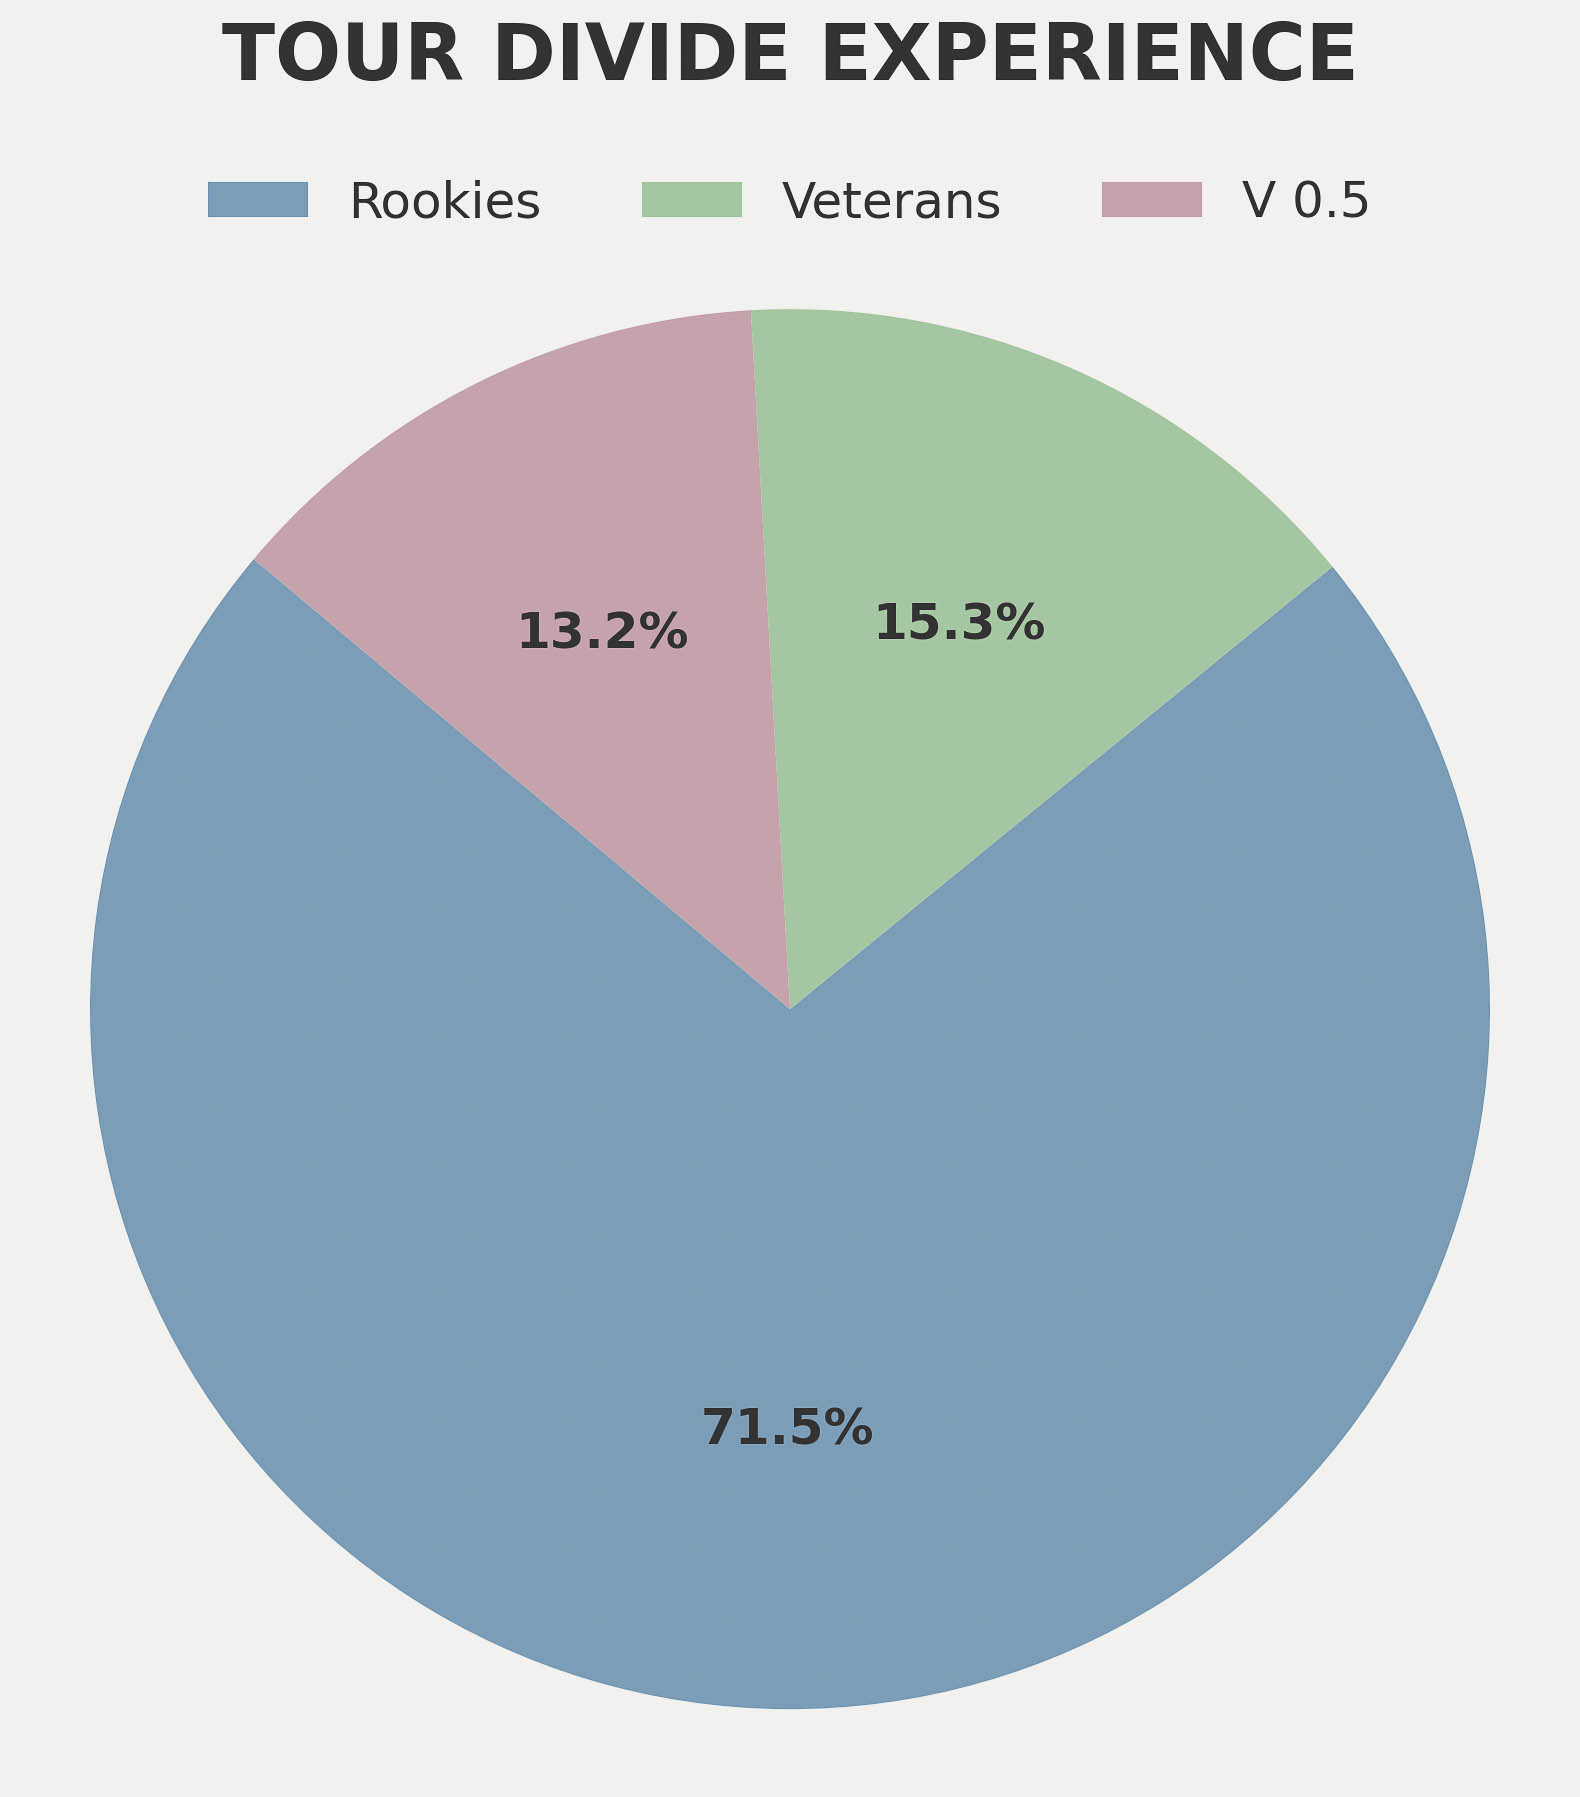
Finally, of the 236 racers, 71.5 percent were rookies, over 15 percent were veterans who have finished, and over 13 percent have lined up to start but have yet to finish. If you want to see some rigs of folks who’ve finished, it’s pretty easy. If you want to dive into the topic, you can look at older Trackleaders finishing times and cross-reference our rigs pages from that same year. Or, if they came back again the following year, you can compare and see what they changed. A few of the more dialed racers this year include Lael Wilcox, Dirty Dan, Mateo, Alexandera, Ana, Jens, and others. But I don’t want to give too much away.

If you’re considering racing, don’t forget to put in the time, do your research, and find out what works for you. So that about does it. Another year of stats and analysis. What findings surprised you? Let me know in the conversation below!
Further Reading
Make sure to dig into these related articles for more info...


Please keep the conversation civil, constructive, and inclusive, or your comment will be removed.